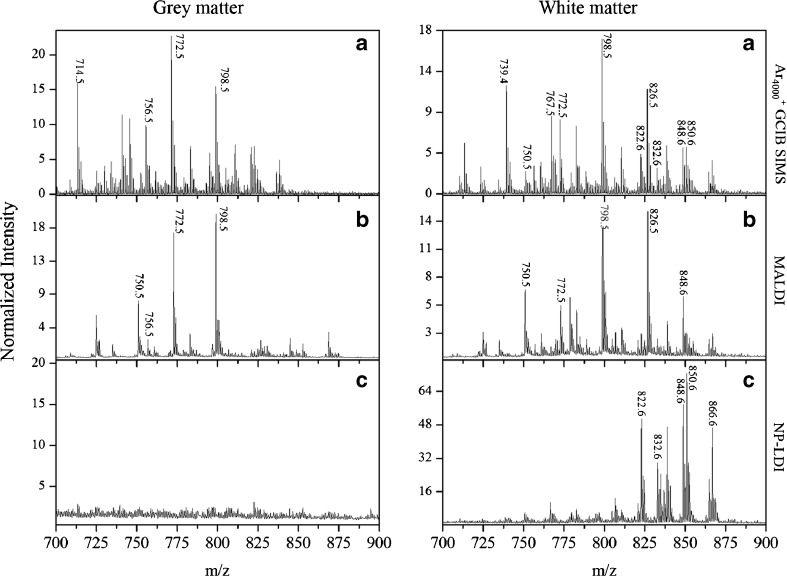
Fig. 2.
Comparison of the mass spectra in the gray and white matter regions obtained from a brain tissue section within the intact lipid mass range (m/z 700–900) using a 40 keV Ar4000 + GCIB SIMS on the nanoparticle-modified tissue, b MALDI with DHB sublimation, and c gold NP-LDI. The spectra for all methods were normalized to total ion counts in the whole spectrum (In SIMS ×109 for gray matter and ×104 for white matter)

