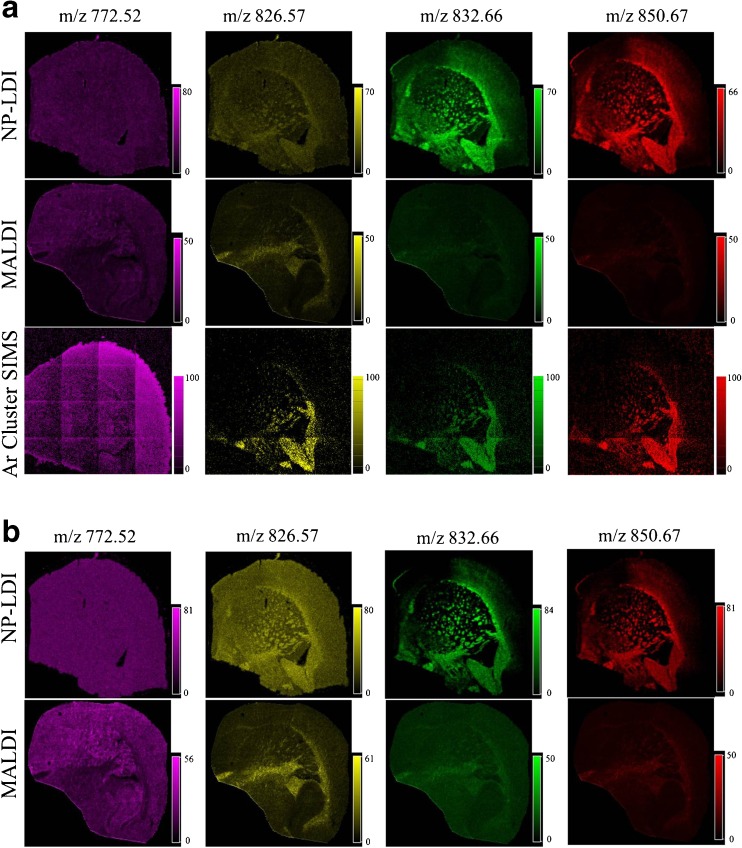
Fig. 4.
Ion images (no normalization (a) and total ion count (TIC) normalization (b) (4800 × 4800 μm2)) obtained from mouse brain tissue using NP-LDI, MALDI with 20-μm laser step size, and Ar GCIB SIMS adjusted to have 20-μm beam spot size. Dominant peaks at m/z 832.66 (sphingolipid [M + Na]+) and m/z 850.67 (cerebroside C48H93NO9 [M + Na]+) were selected for NP-LDI for comparison with dominant peaks at m/z 772.52 (PC (32:0), [M + K]+) and m/z 826.57 (PC (36:1), [M + K]+) for MALDI and Ar GCIB SIMS. NP-LDI images demonstrate distinct distributions for lipid species in the white matter while this is not distinguishable for MALDI with DHB. Ar GCIB SIMS shows the ions localized in both white and gray matter. The number of counts in Ar GCIB SIMS for m/z 772.52, m/z 826.57, m/z 832.66, and m/z 850.67 are 3709, 1763, 1069, and 1176, respectively

