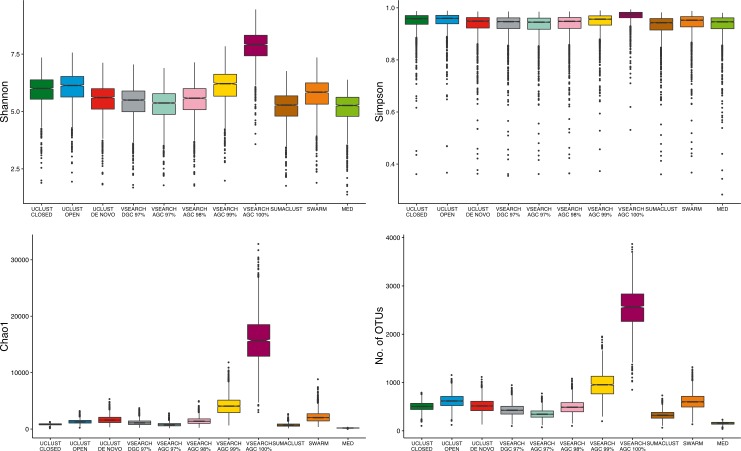
Figure 5. Comparison of absolute alpha diversity values for Shannon, Simpson, Chao1, and OTU count indices across all samples.
OTU tables for each method were rarefied to 10,000 sequences 25 times and the mean diversity calculated across all tables. There was a significant difference in the distribution of diversity values between all methods for all four metrics. De-replicated sequences in particular inflate richness-based measures.

