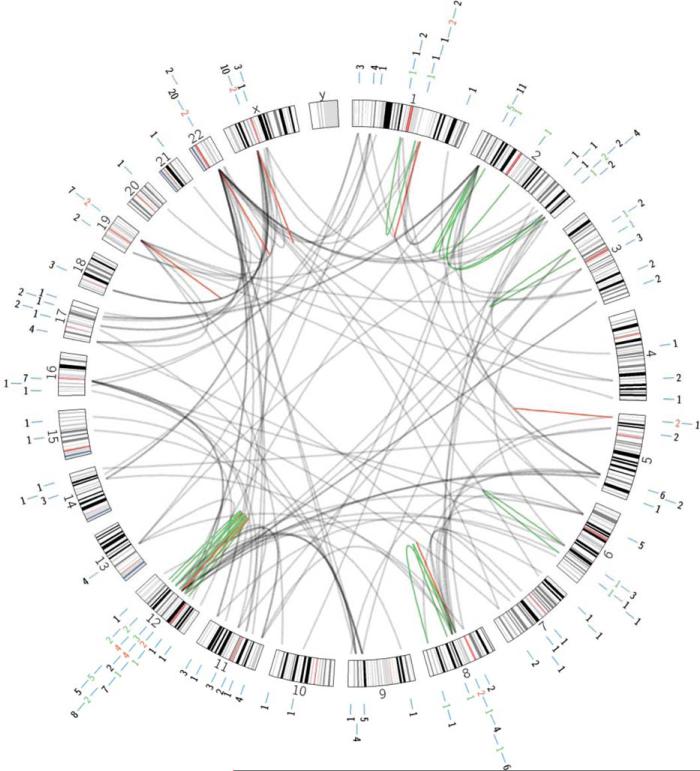
Figure 1.
Circos plot showing the chromosomal distribution of genes involved in recurrent and non-recurrent gene fusiosn in soft tissue tumors. Black lines 5 fusions involving genes on different chromosomes; green lines 5 fusions arising through intra-chromosomal rearrangements; red lines 5 fusion of genes located in the same chromosome band. The numbers outside the circos plot refer to the number of different gene fusions per chromosome band. [Color figure can be viewed in the online issue, which is available at wileyonlinelibrary.com.]

