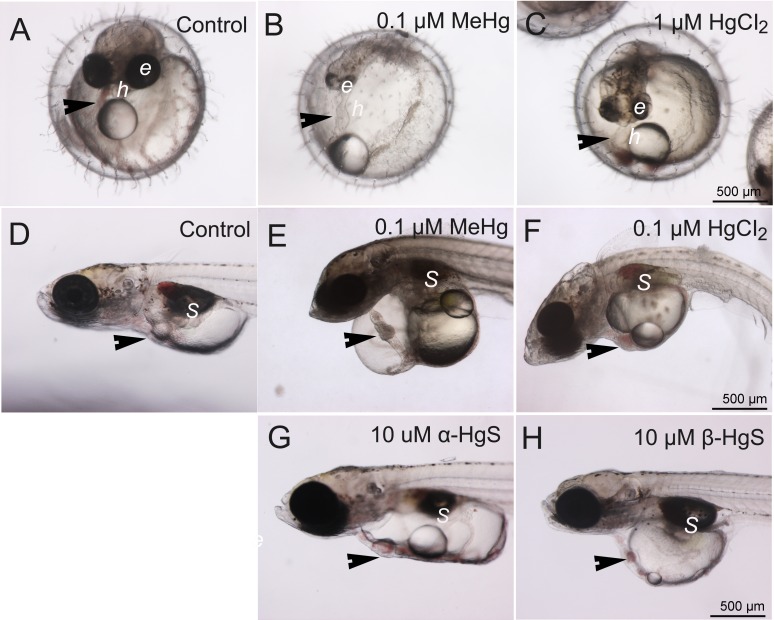
Figure 2. Control morphology and common phenotypic alterations in embryos and larvae following exposure to mercury compounds: embryos at 5 dpf: (A) control; (B) 0.1 µM MeHg; and (C) 1 µM HgCl2.
Larvae at 10 dpf: (D) control; (E) 0.1 µM MeHg; (F) 1 µM HgCl2; (G) 10 µM α-HgS; and (H) 10 µM β-HgS. Arrows point to heart (h); e, eye; S, swim bladder. All images are at the same magnification, scale bar is 500 µm.

