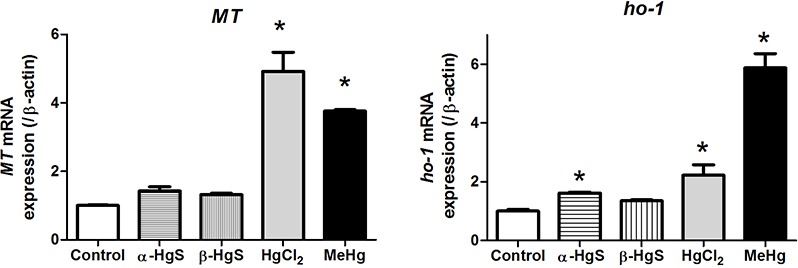
Figure 3. Analysis of gene expression in medaka embryos exposed to mercury compounds.

Medaka embryos were sampled from control, 0.1 µM MeHg, 1 µM HgCl2, 10 µM α-HgS, and 10 µM β-HgS treatment groups (n = 3, 15 embryos pooled per replicate) at 3 days post-exposure. Total RNA was extracted and subjected to RT-PCR analysis for metallothionein (MT) and heme oxygenase-1 (Ho-1) gene expression using β-actin expression as the reference. Data are mean ± SD. *significantly different from controls with p < 0.05.
