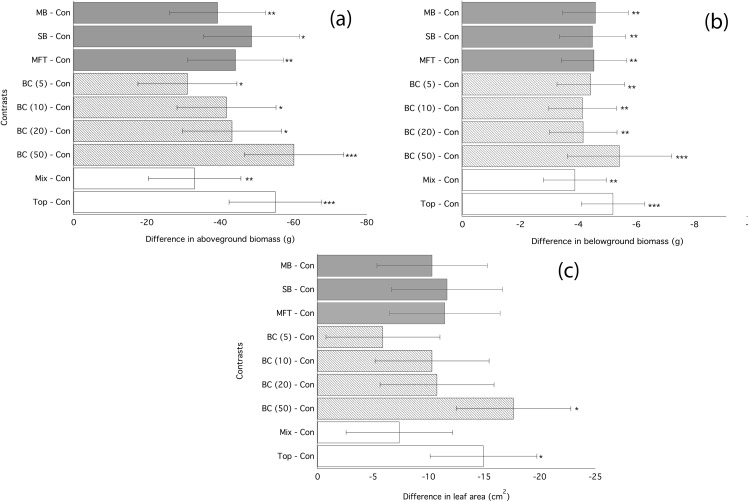
Figure 1. Ryegrass growth responses to fresh biochars: contrasts between treatments.
Simultaneous confidence intervals (95%) for aboveground biomass (A), belowground biomass (B), leaf area (C) of ryegrass to biochar type (MB, SB, MFT), addition rate (5, 10, and 20 t/ha), and application method (Mixed or Top dressing (Top)) (Experiment 1). Significant differences between treatment means are denoted with asterisks (P = < 0.05*, < 0.01**, 0.001***).

