Figure 4.
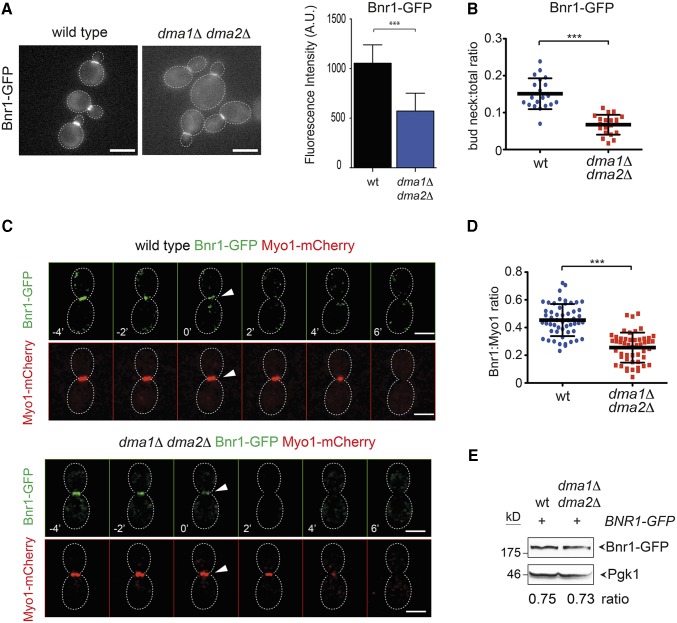
Bnr1 recruitment to the bud neck is affected by DMA1 and DMA2 deletion. (A) Logarithmically growing wild-type and dma1Δ dma2Δ cells expressing Bnr1-GFP were imaged at 25°. Acquired Z-stacks (11 planes at 0.3-μm spacing) were max-projected. Bar, 5 μm. Fluorescence intensities of Bnr1-GFP at the bud neck were quantified on one single in-focus plane in medium-budded cells after drawing a line across the bud neck along the mother–bud axis and measuring the integrated density of the resulting histogram after background correction (n ≥ 14; error bar: SD; *** P < 0.001). (B) Ratios between bud neck and total Bnr1-GFP were calculated after measuring fluorescence intensities in medium-budded cells by ImageJ using the “analyse particles” function applied to a single in-focus plane after background subtraction (n = 20; *** P < 0.001). (C) Wild-type and dma1Δ dma2Δ cells expressing Bnr1-GFP and Myo1-mCherry were imaged every minute at 21°. Z-stacks (31 planes at 0.2-μm spacing) were deconvolved with Huygens and max-projected. Arrowheads indicate the start of AMR contraction that coincides with complete disappearance of Bnr1 at the bud neck. Bar, 3 μm. (D) Wild-type and dma1Δ dma2Δ cells were arrested in S phase by hydroxyurea. Fluorescence intensities of Bnr1-GFP and Myo1-mCherry were measured with ImageJ as in B. A horizontal line in each dot plot indicates the mean ± SD (n ≥ 50; *** P < 0.001). (E) Steady-state levels of Bnr1-GFP were quantified by Western blot analysis in wild-type and dma1Δ dma2Δ cells. Ratios between Bnr1-GFP and Pgk1 (loading control) levels are averaged from three independent blots.

