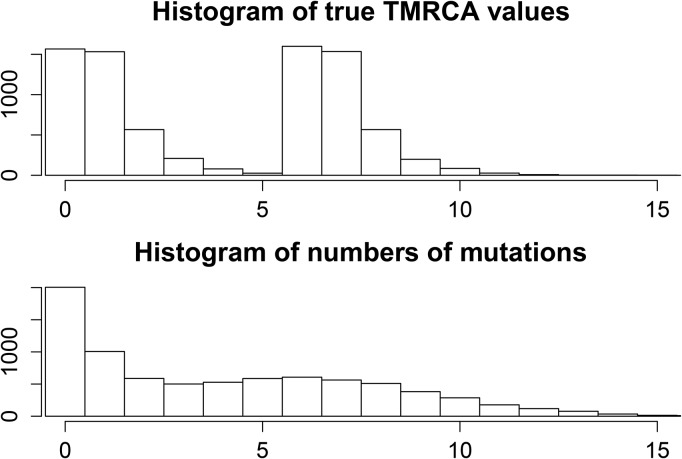
Figure 7.
Histograms of true and inferred TMRCAs in the admixture model. We can see that the number of mutations follows a similar distribution to the true times, but with higher variance. Tang et al.’s (2002) estimate of the TMRCA is proportional to the number of mutations.

