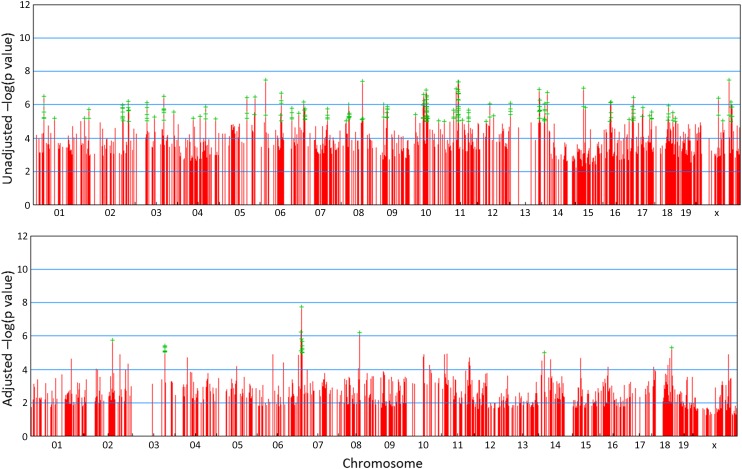
Figure 2.
WGA mapping analysis of IL-12 produced by BMMs from 43 strains of mice in response to LTA stimulation. Top plot shows unadjusted P-values while bottom plot shows P-values after adjustment for relatedness among inbred strains of mice. Green plus symbols designate SNPs significantly associated with LTA-induced IL-12 production.

