Figure 1.
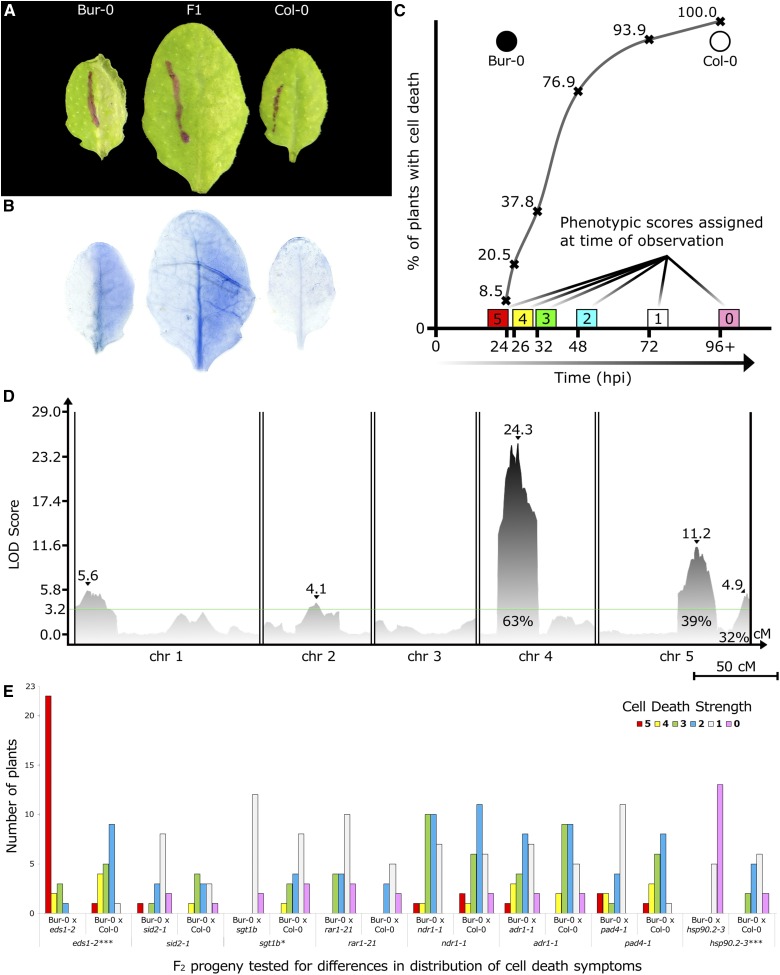
HopAM1 induces variable cell death symptoms of multigenic inheritance in A. thaliana accessions. (A) HopAM1-induced cell death in Bur-0, Col-0, and F1 progeny at 48 hpi after hand inoculation with Pto DC3000D28E(hopAM1). OD600 = 0.1 (∼5 × 10⁷ CFU/ml). Bur-0 exhibits one of the strongest onsets of symptoms as early as 23 hpi, while Col-0 exhibits only chlorosis starting ∼96 hpi. F1 progeny become symptomatic ∼48 hpi. (B) Cell death shown with trypan blue staining on the same leaves as above (48 hpi). (C) Sigmoid distribution of cell death symptoms representative of quantitative traits. The quantification of cell death at specific time points postinoculation is shown. Curve shows the percentage of plants in a Bur-0 × Col-0 RIL population that exhibit cell death symptoms at a given time point. ● = Bur-0; ○ = Col-0. (D) CIM on 342 reannotated RILs from a Col-0 × Bur-0 collection. The x-axis displays chromosomes 1 through 5 with map distances in cM. Peak LOD scores are shown by ▾ along with their values. Effects on phenotype variation are shown as percentages for QTL4 and QTL5A. The global permutation level of significance was set on LOD 3.2. Chr, chromosome. Bar, 50 cM. (E) Distribution of HopAM1-induced cell death scores among different F2 progeny between Bur-0 and mutant lines. The y-axis shows number of plants selected from each population with each phenotype score for HopAM1-induced cell death (5 = Bur-0, 0 = Col-0). Statistical significance between distributions was based on two-way ANOVA tests for each pair (statistical significance: *** P ≤ 0.001, * P ≤ 0.05).

