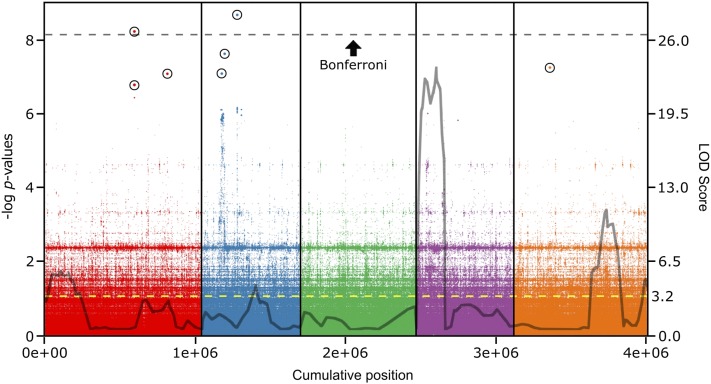
Figure 2.
The genetic architecture of HopAM1 cell death response defined by GWA depends on several loci with strong to moderate effects. HopAM1-induced cell death response was scored in a collection of 64 Arabidopsis accessions. EMMAX was used for GWA mapping based on whole-genome sequence data of >4 million SNPs. The Manhattan plot shows the association of each SNP and its P-value across the five Arabidopsis chromosomes (1 through 5 from left to right, separated by vertical lines). The dotted line designates the significance threshold for Bonferroni correction (P ≤ 1.2 × 10⁻⁸). All SNPs over the FDR threshold are highlighted with a circle. Gray outline reprises the QTL regions identified in Figure 1D in the Bur-0 × Col-0 background (cM converted to Mb only for each genetic marker’s coordinates on the genome and shows LOD score at that specific location; not identical, but very similar to peak LOD scores shown in previous QTL analysis in Figure 1D). Right y-axis, LOD score; yellow dotted line, significance threshold for CIM.

