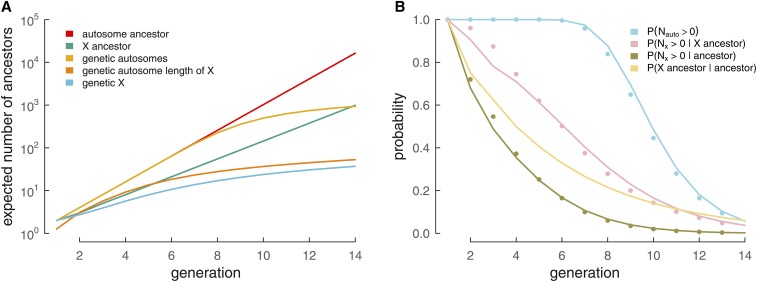
Figure 2.
How the number of genetic and genealogical ancestors and probabilities of sharing genetic material vary back through the generations for different cases. (A) Each line represents a present-day female’s expected number of ancestors (y-axis) in the kth generation (x-axis; where is the parental generation), for a variety of cases. The present-day female’s number of genealogical ancestors in the kth generation is in red, and the expected number of these ancestors that contribute any autosome genetic material is in yellow. Likewise, the present-day female’s number of genealogical X ancestors is in green, and the expected number of these ancestors that contribute any X genetic material is in blue. For comparison, the number of genetic ancestors of an autosome of length equal to the X is included (orange). (B) The probability of genealogical and genetic ancestry (y-axis) from an arbitrary ancestor in the kth generation (x-axis). is derived from equation (The distribution of IBD segments between a present-day individual and an ancestor), from Equation 8, from Equations 8 and 4, and from Equation 4. Circles show simulated results.

