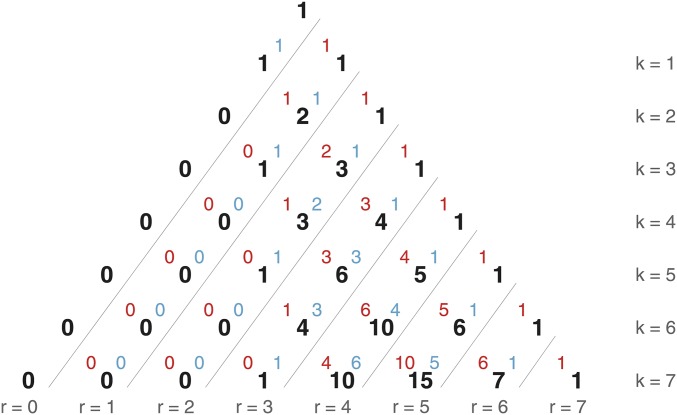
Figure 4.
The number of individuals (black numbers) with r recombinational meioses (each diagonal, labeled at base of triangle) for a generation k (each row). This encodes the number of recombinational meioses as the binomial coefficient Each value is further decomposed into the number of recombinational meioses from the female (red value, upper left) and male (blue value, upper right) lineages. Each black value is calculated by adding the black number to the left in the row above (the number of recombinational meioses from the maternal side) and the black number two rows directly above (the number of recombinational meioses from the paternal side). The sum of each row (fixed k) is a Fibonacci number and the values in the diagonal corresponding to a fixed value of r are binomial coefficients. Reading from the top left side to the bottom right corner, Pascal’s triangle is contained in the red, blue, and black numbers.

