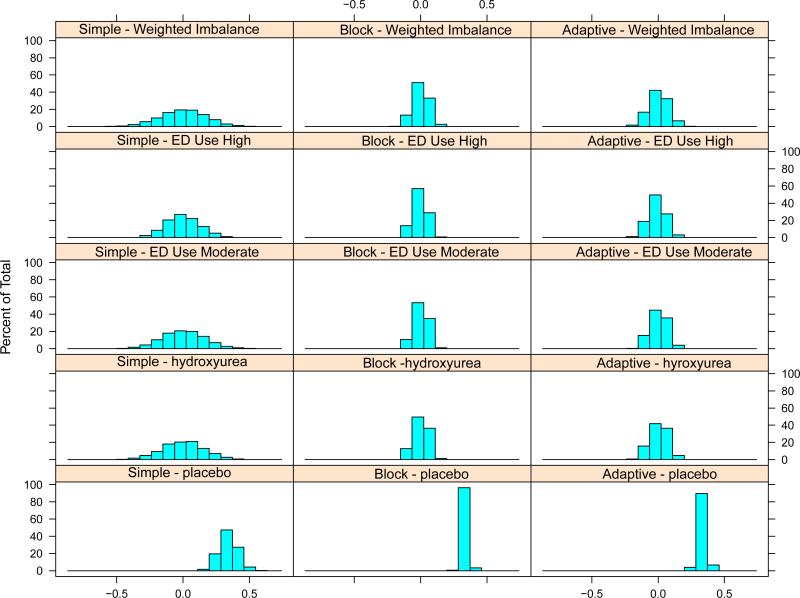
Figure 1. Performance of the three methods.
Histograms depict the final imbalance states of simulated trials of 45 participants. A total of 10,000 sets of virtual patients were generated, and each of the three trial algorithms were applied to each set. For the top four rows, the positive portion of the histogram represents trials with imbalances (and their magnitude) with a higher proportion of that covariate for the placebo group. The bottom row depicts the distribution of final placebo proportion from the various methods.

