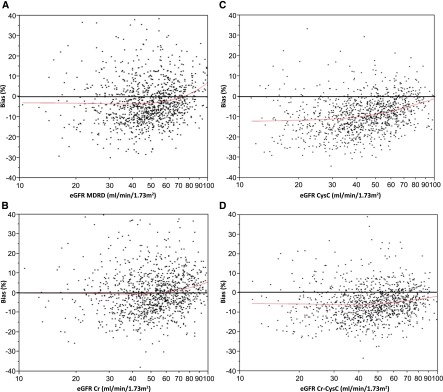
Figure 2.
Equation bias as a function of eGFR. (A) Percentage bias [exp(log eGFR − log measured GFR)−1×100] is on the y axis, and eGFR Modification of Diet in Renal Disease (MDRD) is on the x axis. (B) Percentage bias is on the y axis, and eGFR creatinine (Cr) is on the x axis. (C) Percentage bias is on the y axis, and eGFR cystatin C (CysC) is on the x axis. (D) Percentage bias is on the y axis, and eGFR Cr-CysC is on the x axis.

