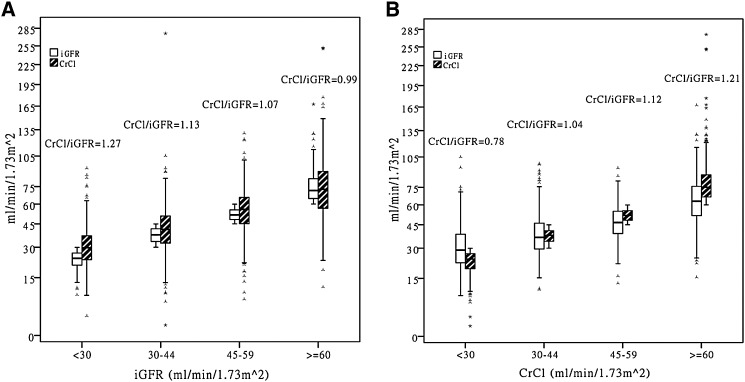
Figure 2.
Distribution of iGFR, CrCl, as well as CrCl/iGFR ratio stratified by categories of iGFR and by categories of CrCl in 1342 CRIC participants (box plots show median, interquartile range, and outliers; whiskers represent the highest and lowest values that are not outliers >1.5 box lengths from one hinge of the box). The much wider spread in the values of the unconstrained kidney function metric versus the constrained values and how this varies by strata of kidney function metric are graphically displayed. For example, in (A), by definition, those in the lowest iGFR category all have iGFR<30 ml/min per 1.73 m2 but the CrCl values among them may be as high as >75 ml/min per 1.73 m2. So the average CrCl/iGFR ratio is >1. By comparison, in (B), those in the lowest CrCl category, by definition, all have CrCl<30 ml/min per 1.73 m2 but the iGFR values among them may be as high as >75 ml/min per 1.73 m2; so, the average CrCl/iGFR ratio is <1. CrCl, urinary creatinine clearance; iGFR, measurement of GFR by iothalamate clearance.

