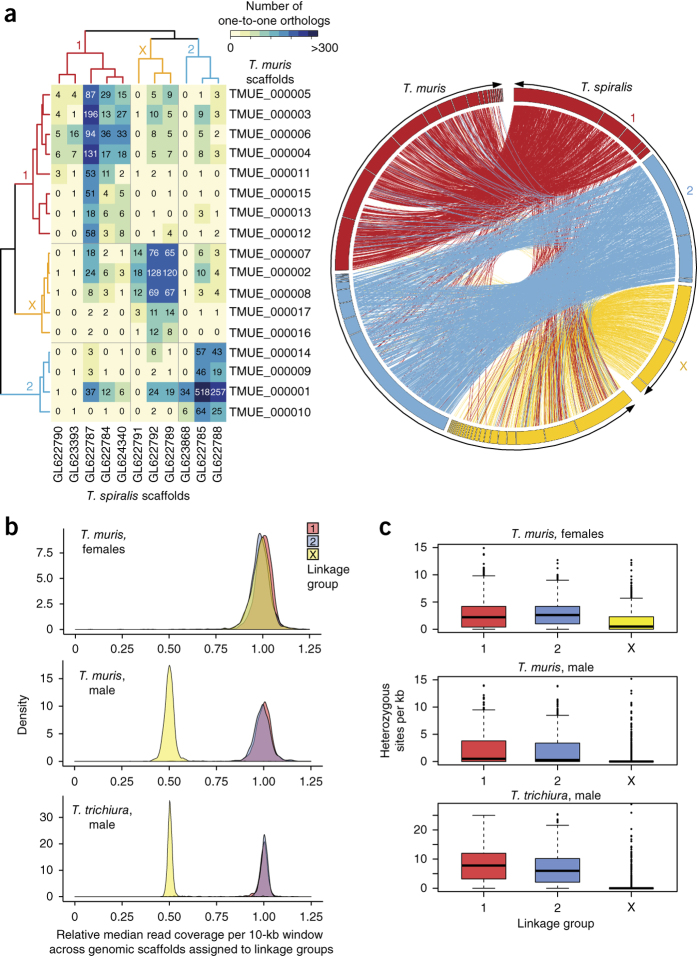
Figure 1. Genome structure and synteny in T. spiralis and Trichuris species.
(a) Mapping one-to-one gene orthologs (as determined by Inparanoid) between genome scaffolds for T. spiralis and T. muris (genome assembly v4) followed by clustering of the resulting ortholog pattern identifies three large linkage groups in each genome (left; Supplementary Note). The table lists the number of one-to-one gene orthologs for individual comparisons between the 11 longest scaffolds of T. spiralis and the 17 longest scaffolds of T. muris, which represent 85.2% and 89.0% of the respective genomes. The relationship of one-to-one gene orthologs shows high-level and cross-genus synteny between T. muris and T. spiralis (right). The linkage group shown in yellow is putatively identified as the sex-specific X chromosome. (b) Median relative coverage of high-throughput sequencing reads was derived for a pool of 11 female T. muris parasites or single male parasites (T. muris and T. trichiura) and was calculated per 10-kb window across all genome scaffolds that were assigned to 1 of the 3 linkage groups. In females, mapped sequence read coverage is even across all three linkage groups, whereas, in males, read coverage exhibits a bimodal distribution. In particular, the linkage group to which scaffolds belong separates well with either of the two peaks of relative read coverage. Scaffolds of linkage group X are associated with half the median read coverage found for scaffolds of linkage groups 1 and 2. (c) Levels of heterozygosity correlate strongly with affiliation with one of the three linkage groups. Both the 0.5-fold relative read coverage and the very low apparent heterozygosity of linkage group X are consistent with the corresponding scaffolds representing the sex-specific X chromosome, which is expected to occur in a single copy in the diploid genome of a male Trichuris parasite. In box plots, the center line is the median, the box shows 25% to 75% quantiles (interquartile range), the top whisker represents the highest data point below (75% quartile + 1.5 × interquartile range) and the bottom whisker shows the lowest data point above (25% quartile + 1.5 × interquartile range).

