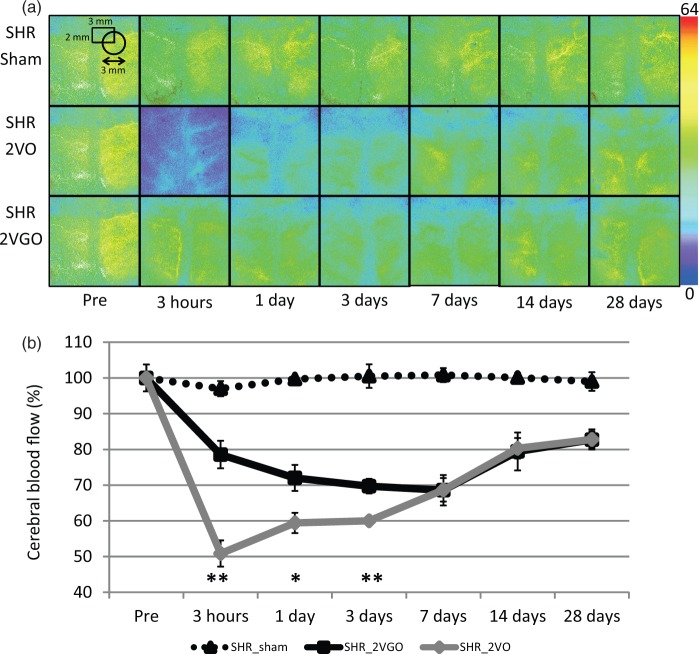
Figure 2.
(a) Representative CBF images of laser speckle flowmetry in each group at indicated time intervals. The value in each image indicates relative CBF that is expressed as a percentage (±SEM) of the baseline level (100%). Four to six animals in each group were used at each point. (b) The temporal profile of CBF in each group. *P < 0.05, **P < 0.01, 2VGO vs. 2VO.

