Figure 4.
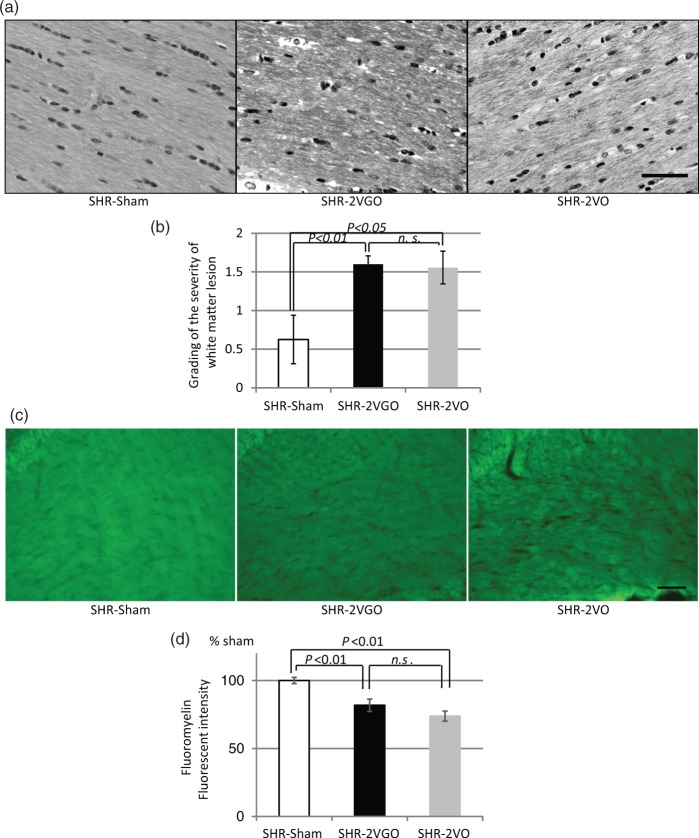
(a, b) Representative images of Klüver-Barrera staining in the corpus callosum (upper panels) with histogram showing the grading of the white matter lesions at 28 days post-operation in the sham (n = 4), 2VGO (n = 10) and 2VO (n = 9) groups. Scale bar, 50 µm. (c, d) Representative images of fluoromyelin staining in the corpus callosum (upper panels) with histogram showing the fluorescent intensity at 28 days post-operation in the sham (n = 4), 2VGO (n = 4) and 2VO (n = 4) groups. Scale bar, 100 µm. The value is expressed as a percentage (±SEM) of the fluorescent intensity of sham-operated rats (100%).

