Figure 5.
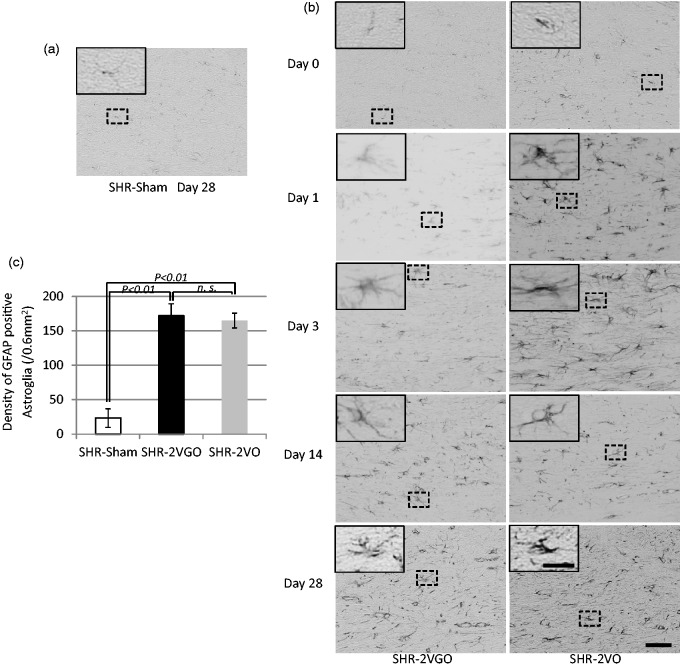
(a, b, c) Representative images of immunostaining for glial fibrillary acidic protein (GFAP) in the corpus callosum at indicated time intervals with histogram showing the density of GFAP immunopositive astroglia at 28 days post-operation in the sham (n = 4), 2VGO (n = 6) and 2VO (n = 6) groups. The inset showing a magnified image of the indicated area. Scale bar, 50 µm; insets, 20 µm.

