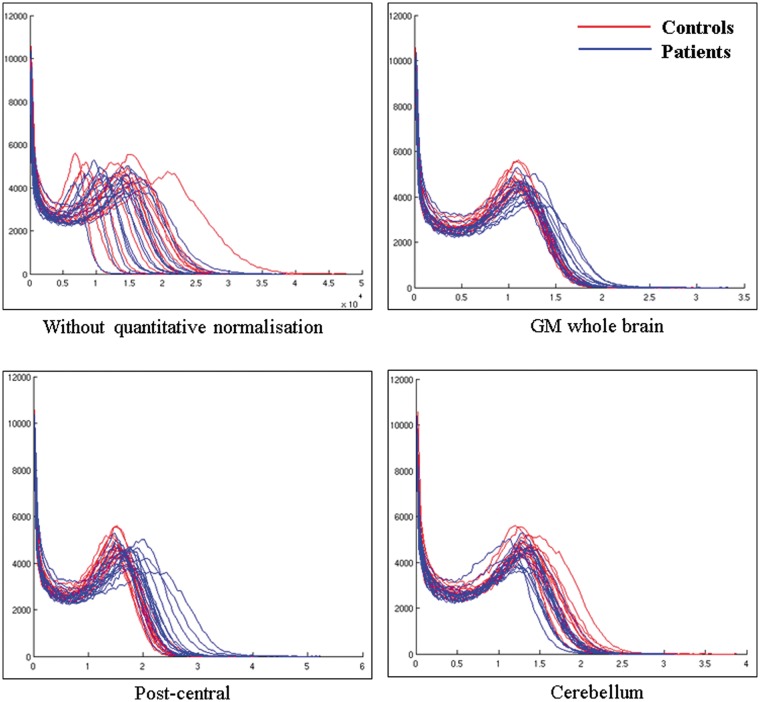
Figure 2.
Histograms showing the distribution of FDG uptake in the whole brain for all subjects with controls in red and patients in blue (a) without quantitative normalisation; normalised with (b) grey matter whole brain, (c) post-central gyrus as used in KS patients using the method of Yakushev et al.33 and (d) our proposed cerebellar region. X-axis represents the voxel intensities within the image and is in kBq/ml for (a) and arbitrary units for (b), (c) and (d). Y-axis represents the frequency (the number of voxels) at which those intensities occur within the image. It seems that normalising using the GM whole brain causes an artificial increase in the area under the blue curves compared to the red ones. The same trend is observed for the post-central gyrus. A general increase in FDG signal in patients goes against what has been observed in previous studies where absolute metabolic values were calculated, suggesting that these quantitatively normalised measurements are artefactual. When using the proposed cerebellar mask as a reference region, the area under the blue curves is smaller than under the red ones. The intensity peaks are also more shifted to the right in the red curves, indicating a better separation between patients and controls when using this proposed reference region.

