

Abstract
The accuracy of cerebral blood flow measurements using pseudo-continuous arterial spin labeling can be affected by vascular factors other than cerebral blood flow, such as flow velocity and arterial transit time. We aimed to elucidate the effects of common variations in vascular anatomy of the circle of Willis on pseudo-continuous arterial spin labeling signal. In addition, we investigated whether possible differences in pseudo-continuous arterial spin labeling signal could be mediated by differences in flow velocities. Two hundred and three elderly participants underwent magnetic resonance angiography of the circle of Willis and pseudo-continuous arterial spin labeling scans. Mean pseudo-continuous arterial spin labeling-cerebral blood flow signal was calculated for the gray matter of the main cerebral flow territories. Mean cerebellar gray matter pseudo-continuous arterial spin labeling-cerebral blood flow was significantly lower in subjects having a posterior fetal circle of Willis variant with an absent P1 segment. The posterior fetal circle of Willis variants also showed a significantly higher pseudo-continuous arterial spin labeling-cerebral blood flow signal in the ipsilateral flow territory of the posterior cerebral artery. Flow velocity in the basilar artery was significantly lower in these posterior fetal circle of Willis variants. This study indicates that pseudo-continuous arterial spin labeling measurements underestimate cerebral blood flow in the posterior flow territories and cerebellum of subjects with a highly prevalent variation in circle of Willis morphology. Additionally, our data suggest that this effect is mediated by concomitant differences in flow velocity between the supplying arteries.
Keywords: Arterial spin labeling, angiography, cerebral blood flow measurement, hemodynamics, magnetic resonance imaging
Introduction
Arterial spin labeling (ASL) is a magnetic resonance imaging (MRI) technique used to noninvasively quantify brain perfusion.1,2 The pseudo-continuous arterial spin labeling (pCASL) is recommended as the current optimal default implementation of ASL for whole brain perfusion imaging.3 pCASL achieves a relatively high labeling efficiency by applying a series of short radiofrequency pulses to magnetically label hydrogen spins of arterial blood.4 This technique has become a valuable tool to determine cerebral blood flow (CBF) in, for instance, patients with Alzheimer’s disease, stroke, and neurodegeneration in general, by combining a considerable spatial resolution with only a few minutes of data acquisition.5–8 However, accurate quantification of pCASL-CBF measurements can be affected by vascular factors other than CBF, such as flow velocity and arterial transit time. Decreased arterial flow velocity in the labeling plane directly disturbs the efficiency of the pCASL labeling process.4,9,10 Moreover, the arterial transit time determines the amount of labeled blood reaching the perfused tissue before image acquisition. As both factors are dependent on vascular anatomy, individual differences in the arterial tree between subjects may introduce undesirable variance in pCASL data.
The circle of Willis (CoW) is an arterial anastomosis located at the base of the brain that is known to demonstrate considerable morphological variation, also among healthy subjects. The prevalence of an incomplete CoW configuration, characterized by hypoplasia or absence of one or more arterial segments, is high and is estimated to be between 53 and 80%.11–17 Routing of arterial blood from the brain feeding arteries is known to vary considerably across these variants.18,19 We hypothesize that altered routing and velocity of arterial blood lead to local changes in pCASL signal in subjects with asymmetrical CoW configurations.
The aim of the present study is to elucidate the effects of common CoW variations on pCASL signal. To this end, we compared gray matter pCASL signal in the main arterial flow territories among the most prevalent CoW variants. In addition, we used phase-contrast MRI to investigate whether possible differences in pCASL signal could be mediated by differences in arterial flow velocities.
Materials and methods
Subjects
Data were obtained from the MRI substudy of the Discontinuation of Antihypertensive Treatment in the Elderly (DANTE) trial: a randomized controlled trial evaluating the effect of temporary (four months) discontinuation of antihypertensive therapy on neuropsychological functioning in older persons with mild cognitive deficits. The DANTE Study Leiden was approved by the medical ethics committee of the Leiden University Medical Center and informed consent was obtained from all participants. In total, 203 of the DANTE participants underwent magnetic resonance angiography (MRA) of the CoW and pCASL MRI scans.
Scan parameters
All MRI scans were acquired on a whole-body magnetic resonance system operating at a field strength of 3-T (Philips Medical Systems, Best, The Netherlands), equipped with a 32-channel head coil. PCASL labeling was performed using a train of 0.5 ms Hanning-shaped radiofrequency pulses with an interpulse pause of 0.5 ms in combination with a gradient strength of 6 mT/m and mean strength of 0.6 mT/m. ASL images were acquired with repetition time (TR)/echo time (TE) = 4000/14 ms, flip angle(FA) = 90° field of view (FOV) = 240 × 133 × 240 mm, matrix size = 80 ×80 mm, 2D EPI multislice readout, 19 slices, 30 averages, labeling time of 1650 ms and a postlabeling delay (PLD) ranging from 1525 ms for the most inferior slice to 2155 ms for the most superior slice, and total scan duration of 4.5 min. 3DT1-weighted images were acquired with TR/TE = 9.7/4.6 ms, FA = 8°, and 224 ×177 × 168 mm FOV, resulting in a nominal voxel size of 1.17 mm × 1.17 mm × 1.4 mm. Three-dimensional time-of-flight (3DTOF) MRA was acquired with a TR/TE = 21/4 ms, FA = 20°, and FOV = 200 mm ×180 mm × 60 mm and were reconstructed into maximum-intensity projection (MIP) images using software supplied by the scanner manufacturer.
Flow and flow velocity measurements
Flow velocity measurements were performed using ungated phase-contrast MRA, based on two localizer MR angiograms in the sagittal and coronal orientation and acquired with the following parameters: TR =13 ms; TE = 8.6 ms; FA = 10°; slice thickness = 5 mm; FOV 150 mm × 103 mm; voxel size 1.17 mm × 1.17 mm; velocity sensitivity = 200 cm/s, 20 signal averages. Regions of interest (ROI) were drawn around the lumen of the internal carotid arteries (ICA) and basilar artery on the magnitude images by an experienced rater. Flow velocities of each voxel were computed from the phase images and averaged over the entire ROI.
CoW anatomy
CoW anatomy of each subject was evaluated using both 3DTOF MRA MIPs and source images. The anterior and posterior parts of each circle were assessed separately by a blinded rater according to a simplified version of the classification scheme used in an earlier study.11 Following this classification, a complete posterior CoW was defined by the presence of two well-developed (diameter > 0.8 mm) P1 segments of the posterior cerebral artery, in combination with the posterior communicating arteries on both sides being either absent or hypoplastic (diameter < 0.8 mm). Although we did not perform directional flow measurements, it is expected that, in the absence of stenotic disease in the internal carotid or basilar arteries, the individual P1 segments are responsible for filling of the subsequent P2 segments on their side.
The unilateral fetal posterior CoW variant was defined by a unilaterally absent or hypoplastic P1 segment of the posterior cerebral artery, in combination with the ipsilateral posterior communicating artery having a diameter > 0.8 mm. Flow in the ipsilateral P2 segment will therefore originate fully or mainly from the ipsilateral ICA by flow through the ipsilateral posterior communicating artery. Again, although directional flow measurements in the posterior communicating artery were not performed, it is highly unlikely that in these cases flow direction is in the posterior to anterior direction.
Anterior CoW morphology was considered nonvariant when both precommunicating segments of the anterior cerebral artery (A1 segments) were clearly visible with a diameter > 0.8 mm. The variant type anterior CoW morphology was defined by a missing A1 segment of the anterior cerebral artery on one side, with the ipsilateral postcommunicating segment of the anterior cerebral artery (A2 segment) filled by the contralateral ICA by cross flow through the anterior communicating artery.
The present study protocol was not specifically designed for screening occlusive disease in the entire tract of the common carotid artery, internal carotid artery, basilar artery, and vertebral arteries. For the anterior circulation, screening was performed from approximately 2 cm below the carotid bifurcation and up. Of the posterior circulation, only the basilar artery was checked. None of the subjects included in the present study demonstrated occlusion or stenosis of these arteries on MRA.
PCASL-CBF quantification
pCASL images were first corrected for slice timing, gradient nonlinearities, and subject motion using in-house software and different tools of the FMRIB Software Library (FSL) version 5.0.6.20 The perfusion-weighted images were converted into CBF maps in units of ml/100 g/min using a single compartment model assuming a labeling efficiency of 85%.3 Next, CBF maps were skull stripped using FSL’s BET tool21 and all registered to MNI152 (Montreal Neurological Institute) standard space via each subject’s respective T1-weighted image using linear and nonlinear registration.22,23 Gray matter masks were generated from each subject’s standard space registered T1-weighted image with FSL’s FAST tool24 and used to calculate mean cerebral and cerebellar gray matter pCASL-CBF. Rectangular ROIs for the flow territories of the anterior cerebral arteries (ACA), middle cerebral arteries (MCA), and posterior cerebral arteries (PCA) were drawn manually on the 2 mm MNI152 template (Figure 1). General locations of these ROIs were based on an earlier flow territory mapping study.25 These ROI templates were subsequently used with each subject’s gray matter mask to calculate the mean gray matter CBF in units of ml/100 g/min for each flow territory.
Figure 1.
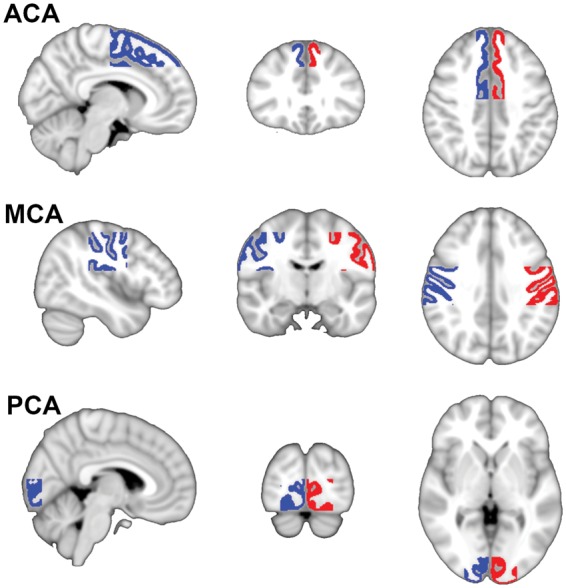
This figure shows the ROIs used to quantify mean pCASL-CBF in the left and right arterial flow territories. Blue indicates right and red indicates left. ACA: anterior cerebral artery; MCA: middle cerebral artery; PCA: posterior cerebral artery.
Statistical analysis
Data from left-sided and right-sided CoW variants were pooled by considering the side of the variant or absent artery as ipsilateral. Differences in pCASL-CBF between the ipsilateral and contralateral flow territories of the ACA, MCA, and PCA were assessed by paired t-tests. Differences in flow velocity between the brain feeding arteries were also compared using paired t-tests. Flow territory pCASL-CBF values that significantly differed within CoW variants were subsequently compared with the corresponding values of the nonvariant CoW using binary logistic regression, correcting for age and gender. Whole-brain and cerebellar gray matter pCASL-CBF values were compared between CoW variants using binary logistic regression with age and gender correction. A p-value of < 0.05 was considered statistically significant. Data are presented as mean ± SEM unless stated otherwise. PCASL-CBF values are presented in units of ml/100 g/min.
Results
Subject characteristics are summarized in Table 1. Mean age was 80.8 (SD 4.1) years, (range: 75–96 years), and 56% (n = 115) of the study population was female. Mean gray matter pCASL-CBF of the entire group was 35.9 (SD 9.4) ml/100 g/min.
Table 1.
Subject characteristics.
| n = 203 | |
|---|---|
| Demographic | |
| Age, years | 80.8 ± 4.1 |
| Female, n (%) | 115 (56.7) |
| Vascular risk factors | |
| Smoking status | |
| Never, n (%) | 85 (41.9) |
| Former, n (%) | 104 (51.2) |
| Current, n (%) | 14 (6.9) |
| Diabetes mellitus, n (%) | 39 (19.2) |
| Systolic blood pressure, mmHg | 147 ± 21 |
| Diastolic blood pressure, mmHg | 82 ± 11 |
| MRI characteristics | |
| Mean gray matter pCASL-CBF, ml/100 g/min | 36.0 ± 9.4 |
| Normalized brain volume, ml | 1332 ± 57 |
pCASL-CBF: pseudo-continuous arterial spin labeling.
Data are presented as mean ± SD or number of subjects with variable present (% of total).
CoW anatomy
Table 2 shows the prevalence of CoW variants in the study population. CoW anatomy could not be evaluated in 16 of 203 subjects due to low scan quality caused by motion artifacts, leaving 187 subjects for analysis. For the anterior part of the CoW, 89.8% of subjects had patent A1 segments and were classified as nonvariant. 10.2% had a missing unilateral A1 segment with both A2 segments filled from one side, constituting a “missing A1” variant.
Table 2.
Prevalence of circle of Willis variants.
| n | % of total | |
|---|---|---|
| Anterior | ||
| Nonvariant | 168 | 89.8 |
| Missing A1 | 19 | 10.2 |
| Posterior | ||
| Nonvariant | 117 | 62.6 |
| Fetal PCA hyp. P1 | 21 | 11.2 |
| Fetal PCA no P1 | 19 | 10.2 |
| Other | 30 | 16.0 |
| Fully nonvariant | 105 | 56.1 |
| Total | 187 |
A1: precommunicating segment of the anterior cerebral artery; Hyp.: hypoplastic; P1: precommunicating segment of the posterior cerebral artery; PCA: posterior cerebral artery.
Anterior and posterior anatomy was evaluated separately in all subjects. CoW variants deemed too rare to be included in analysis were classified as “other.” Circles considered nonvariant in both anterior and posterior parts were classified as fully nonvariant.
For the posterior part of the CoW, 62.6% of subjects had a nonvariant configuration. The unilateral fetal-type PCA variant was found in 21.4% of subjects. In these cases, the ipsilateral P1 segment was either hypoplastic (11.2%) or absent (10.2%). The posterior fetal CoW variant was divided into subgroups based on whether the ipsilateral P1 segment was absent or hypoplastic. In the remaining 16.0% (n = 30) of subjects, six uncommon posterior CoW variants were found. This group of “other” variants consisted of a bilateral fetal-type variant (n = 10), a non-fetal-type variant with unilateral absence of the posterior communicating arteries on either the left (n = 6) or right (n = 5) side, a bilateral fetal-type variant lacking both P1 segments (n = 5) and a bilateral fetal-type variant with an absent left (n = 2) or right (n = 2) P1 segment. Due to the anatomical heterogeneity of this group and as our hypothesis only concerned asymmetrical variants, these six less prevalent posterior variants were not evaluated further.
Nonvariant morphology in both the anterior and posterior part of the CoW (the fully nonvariant type) was found in 56.1% of all subjects.
CoW variants and gray matter pCASL-CBF in cerebrum and cerebellum
No significant differences were found in whole-brain mean cerebral gray matter pCASL-CBF between subjects with a fully non-variant-type CoW (36.0 ± 0.9), a missing A1 segment (34.5 ± 1.9), or posterior fetal-type CoW configuration (35.8 ± 1.4).
Mean cerebellar gray matter pCASL-CBF was significantly lower in subjects having a posterior fetal CoW configuration with an absent ipsilateral P1 segment compared with subjects having a nonvariant posterior CoW (21.5 ± 2.5 versus 28.6 ± 1.2, p = 0.032). No significant differences were found in mean cerebellar gray matter pCASL-CBF between the two anterior variants.
Figure 2 shows the mean pCASL-CBF maps for the nonvariant type of the CoW: n = 117, the fetal variant with a hypoplastic left-sided P1 segment: n = 8, and the fetal variant with an absent left-sided P1 segment: n = 14. In both fetal variants, a lower pCASL-CBF signal can be seen on the posterior side contralateral to the fetal-type PCA.
Figure 2.
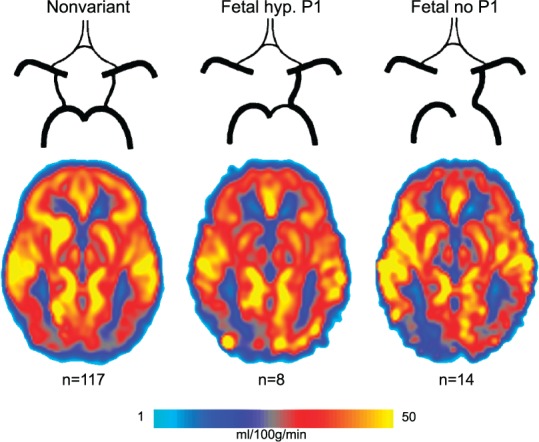
Mean pCASL-CBF maps for the left-sided cases of the three most prevalent posterior circle of Willis variants. A reduction in pCASL-CBF signal can be seen on the posterior side contralateral to the fetal-type posterior cerebral artery. Fetal hyp. P1: fetal variant with hypoplastic ipsilateral P1 segment; Fetal no P1: fetal variant lacking the ipsilateral P1 segment.
CoW variants and pCASL-CBF in the flow territories
PCASL-CBF data of the individual PCA, MCA, and ACA flow territories for the various CoW variants are shown in Figure 3. As shown by these data, there is ipsilateral to contralateral asymmetry of pCASL-CBF signal between the PCA flow territories in the posterior fetal CoW variant. In the fetal variant with the hypoplastic ipsilateral P1 segment, mean pCASL-CBF in the ipsilateral PCA flow territory was 40.2 ± 2.7 ml/100 g/min compared with 33.0 ± 2.2 ml/100 g/min in the contralateral territory (p = 0.003). For the fetal variant with an absent ipsilateral P1 segment, mean pCASL-CBF in the ipsilateral PCA flow territory was 32.1 ± 3.1 ml/100 g/min compared with 21.9 ± 3.06 ml/100 g/min in the contralateral territory (p < 0.001). To investigate whether signal was higher or lower in the fetal variant than in the nonvariant, we compared pCASL-CBF signal in the PCA flow territories between these populations. Subjects with a posterior fetal configuration showed higher pCASL-CBF signal in the ipsilateral PCA flow territory compared to the left PCA flow territory of subjects with a nonvariant posterior configuration (36.3 ± 2.1 versus 28.9 ± 1.26 ml/100 g/min, p = 0.004).
Figure 3.

Flow territory gray matter pCASL-CBF data for the three most prevalent posterior circle variants. Data from left-sided and right-sided variants were pooled by considering the side of the fetal PCA as ipsilateral. (a) pCASL-CBF data of the flow territories of the posterior cerebral arteries. (b) pCASL-CBF data of the flow territories of the middle cerebral arteries. (c) pCASL-CBF data of the flow territories of the anterior cerebral arteries. On the x-axis, from left to right: nonvariant, fetal variant with hypoplastic ipsilateral P1 segment, fetal variant lacking the ipsilateral P1 segment. ACA: anterior cerebral artery; CBF: cerebral blood flow; GM: gray matter; MCA: middle cerebral artery; PCA: posterior cerebral artery. *** = p < 0.01.
Anatomical asymmetry in the posterior part of the CoW did not result in significant asymmetry in the MCA (Figure 3(b)) or ACA (Figure 3(c)) flow territories. Also, the pCASL-CBF signal in these flow territories did not differ significantly between posterior CoW variants.
No pCASL-CBF asymmetries were found in the MCA and ACA flow territories for the two most prevalent anterior CoW variants (Figure 4(a) and (b)).
Figure 4.
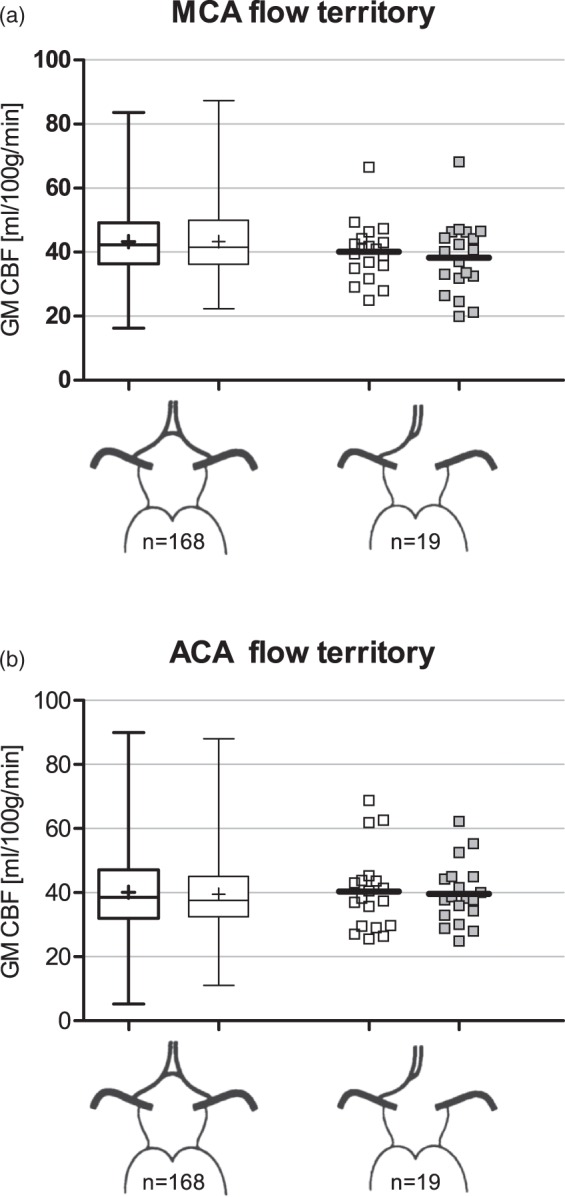
Flow territory gray matter pCASL-CBF data for the two most prevalent anterior circle variants. (a) pCASL-CBF data of the flow territories of the middle cerebral arteries. (b) pCASL-CBF data of the flow territories of the anterior cerebral arteries. On the x-axis: left shows the nonvariant configuration and right shows the missing A1 segment configuration. Data from subjects missing the left-sided or right-sided A1segment were pooled by considering the side of the missing A1 segment as ipsilateral. ACA: anterior cerebral artery; CBF: cerebral blood flow; GM: gray matter; MCA, middle cerebral artery.
Flow and flow velocity
The mean flow velocity was measured in the basilar artery and both internal carotid arteries for all included subjects (Table 3). We only compared the flow and flow velocities of the posterior fetal variants, as these showed asymmetry in the pCASL-CBF analysis.
Table 3.
Mean flow velocity data.
| Artery |
|||
|---|---|---|---|
| Basilar | Ipsilateral ICA | Contralateral ICA | |
| Fvel (cm/s) | Fvel (cm/s) | Fvel (cm/s) | |
| Fully nonvariant | 10.6 ± 0.5 | 11.4 ± 0.4 | 11.3 ± 0.4 |
| Anterior | |||
| Nonvariant | 9.9 ± 0.4 | 11.6 ± 0.3 | 11.6 ± 0.3 |
| Missing A1 | 8.8 ± 0.9 | 11.3 ± 0.8 | 9.1 ± 0.8 |
| Posterior | |||
| Nonvariant | 10.5 ± 0.5 | 11.4 ± 0.4 | 11.1 ± 0.4 |
| Fetal PCA hyp. P1 | 9.3 ± 0.7* | 11.8 ± 0.9 | 11.6 ± 0.7 |
| Fetal PCA no P1 | 8.0 ± 0.5* | 11.3 ± 0.6 | 12.0 ± 0.8 |
A1: precommunicating segment of the anterior cerebral artery; Fvel: flow velocity; hyp.: hypoplastic; ICA: internal carotid artery; PCA: posterior cerebral artery; P1: precommunicating segment of the posterior cerebral artery.
Mean flow velocity (Fvel) data are presented as mean ± SEM. The left side is denoted as ipsilateral for the nonvariant and fully nonvariant cases. Anterior and posterior anatomy was evaluated separately in all subjects. Circles considered nonvariant in both anterior and posterior parts were classified as fully nonvariant.
Indicates a statistically significant difference from the ipsilateral ICA at p < 0.01.
In both posterior fetal variants, mean flow velocity was significantly lower in the basilar artery than in the ipsilateral ICA (p < 0.01). Moreover, basilar artery flow velocity was significantly lower in these posterior fetal variants (irrespective of P1 segment morphology) compared with the nonvariant posterior CoW configuration (8.7 ± 0.4 versus 10.5 ± 0.5 cm/s, p = 0.038).
Blood flow in the basilar artery was significantly lower in the posterior fetal variant with a hypoplastic ipsilateral P1 segment compared to the nonvariant CoW configuration (1.65 ± 0.09 versus 2.37 ± 0.07 ml/s, p < 0.001). This was also the case for the posterior fetal variant lacking the ipsilateral P1 segment (1.41 ± 0.08 ml/s, p < 0.001).
Discussion
Our data show that a unilateral posterior fetal CoW variant has significant left–right asymmetry in pCASL-CBF signal in the PCA flow territory, combined with decreased pCASL-CBF signal in the cerebellum. Additionally, the pCASL-CBF signal in the PCA flow territory ipsilateral to the variant artery was increased in the fetal-type CoW compared with nonvariant subjects. The absence of an A1 segment had no effect on the pCASL-CBF signal in any of the flow territories.
Although we found an asymmetry in pCASL-CBF signal, it is unlikely that the effects of the posterior fetal variant in the PCA flow territories can be explained by an actual physiological difference in CBF, as an earlier study has shown that there is no difference in blood flow between the P2 segments in subjects with this variant.18 The observed effect of a fetal posterior circulation on cerebellar pCASL-CBF might well have a similar nonphysiological origin.
We propose two possible explanations for these effects, both related to flow velocity. It might be that perfusion of these flow territories through different vascular routes results in differences in arterial transit time. Another explanation suggests that the cause of the observed effects lies in labeling efficiency differences between arteries.
Arterial transit time is a known confounder of pCASL-CBF quantification26,27 and is known to vary between brain regions as well as individuals.28,29 As the pCASL label decay rate is governed by the T1 relaxation time of the arterial blood, the time between labeling and acquisition (the PLD) has to be limited to preserve SNR (Signal to Noise). Longer arterial transit times can thus locally bias CBF measurements by incomplete delivery of labeled blood to the tissue before image acquisition. In posterior fetal variants, the basilar artery feeds a much smaller part of the posterior circulation which is reflected in reduced blood flow through this vessel.18,19,30 This does not have to result in a decreased flow velocity, as the diameter of the basilar artery could be decreased as well. However, our data showed a reduced flow velocity in the basilar artery in subjects with a unilateral fetal PCA compared with nonvariant subjects. The decreased pCASL signal found in the flow territory fed by the basilar artery might be explained by a longer arterial transit time caused by the lower flow velocity of this arterial route. Ultimately, this might mean less label reaches the tissue before image acquisition leading to local CBF underestimations.
The higher pCASL-CBF seen in the ipsilateral PCA territory of fetal variants when compared with the nonvariant configuration can be explained by similar reasoning, as flow velocity of the ICA feeding this territory in the fetal variant is significantly higher than basilar artery velocity. Thus, more label can accumulate in the tissue due to lower transit times.
Differences in labeling efficiency between arteries may be another explanation for our observations. PCASL-CBF measurements are highly dependent on labeling efficiency, which is, in turn, dependent on the blood flow velocity in the labeled arteries.4,9,10 In the posterior fetal variant, the ipsilateral PCA flow territory is fed by the ICA, while contralateral is fed by the basilar artery. As shown by our data, ICA flow velocity is significantly higher than basilar artery flow velocity in this variant. Earlier studies used simulations of the pCASL labeling process to estimate labeling efficiency as a function of flow velocity in the labeling plane.4,10,31 These simulations show that labeling efficiency increases almost linearly with velocity until velocities of approximately 20 cm/s are reached and the relationship reaches a plateau. In our cohort, the measured flow velocities in the cerebropetal arteries were far lower than 20 cm/s. In this velocity range, a small absolute difference in flow velocity between arteries can cause a wide disparity in labeling efficiency, thus confounding CBF measurements.
An important limitation of the current study is that the used ASL sequence only had a single PLD (in line with the international consensus statement on ASL3). This makes it impossible to quantify arterial transit times from the ASL data. It would be very informative to know how arterial transit time in, for example, the posterior flow territories would depend on the configuration of the CoW. This may yield further insight in how exactly the configuration of the CoW affects CBF quantification.
Irrespective of whether the arterial transit time or labeling efficiency explanation is considered the more likely cause of these results, the fact that only hypertensive elderly persons were included might limit the generalizability of this study. As cerebrovascular flow velocity is known to decrease with age,32–34 the effects of CoW morphology on pCASL-CBF presented in this study may be attenuated or absent in younger, healthier subjects.
As no directional flow measurements were available for this study, flow direction in the arterial segments could not be verified. Retrograde flow through the posterior communicating artery generally only occurs in the presence of severe occlusion of an ICA. As no ICA stenoses or occlusions were detected in the study population, the chance of retrograde flow interfering with the adequate interpretation of the results is small.
To our best knowledge, this is the first study directly investigating the effect of CoW anatomy on the accuracy of whole-brain CBF measurements using pCASL. PCASL is widely used for CBF measurements in population studies and is in the process of being adapted for clinical use. Pinpointing sources of unwanted between-subject and within-subject variance in pCASL data is important for the interpretation of findings and to further aid in the technique’s standardization.
In conclusion, this study demonstrates that pCASL measurements underestimate CBF in the posterior flow territories and cerebellum of subjects with a highly prevalent variation in CoW morphology. Additionally, our data suggest that this effect is mediated by concomitant differences in flow velocity between arteries.
Funding
The author(s) disclosed receipt of the following financial support for the research, authorship, and/or publication of this article: The DANTE Study Leiden was supported by a grant from the Netherlands Organization for Health Research and Development (ZonMW), Program Priority Medicines for the Elderly, grant number: 40-41600-98-9014.
Declaration of conflicting interests
The author(s) declared no potential conflicts of interest with respect to the research, authorship, and/or publication of this article.
Authors’ contribution
JJHBW analyzed the data and wrote the manuscript. JvdG designed and supervised the study. MJPvO advised on the technical aspects of the study and designed the pCASL protocol of the DANTE-trial. JvdG, JCFD, JEFM, AJMdC, WdR, and RCvdM were involved in the design and data collection of the DANTE-trial. All authors read and edited the manuscript.
References
- 1.Detre JA, Leigh JS, Williams DS, et al. Perfusion imaging. Magn Reson Med 1992; 23: 37–45. [DOI] [PubMed] [Google Scholar]
- 2.Detre JA, Alsop DC. Perfusion magnetic resonance imaging with continuous arterial spin labeling: methods and clinical applications in the central nervous system. Eur J Radiol 1999; 30: 115–124. [DOI] [PubMed] [Google Scholar]
- 3.Alsop DC, Detre JA, Golay X, et al. Recommended implementation of arterial spin-labeled perfusion MRI for clinical applications: a consensus of the ISMRM perfusion study group and the European consortium for ASL in dementia. Magn Reson Med 2014; 73: 102–116. [DOI] [PMC free article] [PubMed] [Google Scholar]
- 4.Dai W, Garcia D, de Bazelaire C, et al. Continuous flow-driven inversion for arterial spin labeling using pulsed radio frequency and gradient fields. Magn Reson Med 2008; 60: 1488–1497. [DOI] [PMC free article] [PubMed] [Google Scholar]
- 5.Heijtel DF, Mutsaerts HJ, Bakker E, et al. Accuracy and precision of pseudo-continuous arterial spin labeling perfusion during baseline and hypercapnia: a head-to-head comparison with (1)(5)O H(2)O positron emission tomography. Neuroimage 2014; 92: 182–192. [DOI] [PubMed] [Google Scholar]
- 6.Xu G, Rowley HA, Wu G, et al. Reliability and precision of pseudo-continuous arterial spin labeling perfusion MRI on 3.0 T and comparison with 15O-water PET in elderly subjects at risk for Alzheimer’s disease. NMR Biomed 2010; 23: 286–293. [DOI] [PMC free article] [PubMed] [Google Scholar]
- 7.Xekardaki A, Rodriguez C, Montandon ML, et al. Arterial spin labeling may contribute to the prediction of cognitive deterioration in healthy elderly individuals. Radiology 2015; 274: 490–499. [DOI] [PubMed] [Google Scholar]
- 8.Grade M, Hernandez Tamames JA, Pizzini FB, et al. A neuroradiologist’s guide to arterial spin labeling MRI in clinical practice. Neuroradiology 2015; 57: 1181–1202. [DOI] [PMC free article] [PubMed] [Google Scholar]
- 9.Aslan S, Xu F, Wang PL, et al. Estimation of labeling efficiency in pseudocontinuous arterial spin labeling. Magn Reson Med 2010; 63: 765–771. [DOI] [PMC free article] [PubMed] [Google Scholar]
- 10.Wu WC, Fernandez-Seara M, Detre JA, et al. A theoretical and experimental investigation of the tagging efficiency of pseudocontinuous arterial spin labeling. Magn Reson Med 2007; 58: 1020–1027. [DOI] [PubMed] [Google Scholar]
- 11.Krabbe-Hartkamp MJ, van der Grond J, de Leeuw FE, et al. Circle of Willis: morphologic variation on three-dimensional time-of-flight MR angiograms. Radiology 1998; 207: 103–111. [DOI] [PubMed] [Google Scholar]
- 12.De Silva KR, Silva R, Gunasekera WS, et al. Prevalence of typical circle of Willis and the variation in the anterior communicating artery: a study of a Sri Lankan population. Ann Indian Acad Neurol 2009; 12: 157–161. [DOI] [PMC free article] [PubMed] [Google Scholar]
- 13.Li Q, Li J, Lv F, et al. A multidetector CT angiography study of variations in the circle of Willis in a Chinese population. J Clin Neurosci 2011; 18: 379–383. [DOI] [PubMed] [Google Scholar]
- 14.Kapoor K, Singh B, Dewan LI. Variations in the configuration of the circle of Willis. Anat Sci Int 2008; 83: 96–106. [DOI] [PubMed] [Google Scholar]
- 15.Eftekhar B, Dadmehr M, Ansari S, et al. Are the distributions of variations of circle of Willis different in different populations? – results of an anatomical study and review of literature. BMC Neurol 2006; 6: 22. [DOI] [PMC free article] [PubMed] [Google Scholar]
- 16.Riggs HE, Rupp C. Variation in form of circle of Willis. The relation of the variations to collateral circulation: anatomic analysis. Arch Neurol 1963; 8: 8–14. [DOI] [PubMed] [Google Scholar]
- 17.Vrselja Z, Brkic H, Mrdenovic S, et al. Function of circle of Willis. J Cereb Blood Flow Metab 2014; 34: 578–584. [DOI] [PMC free article] [PubMed] [Google Scholar]
- 18.Zarrinkoob L, Ambarki K, Wahlin A, et al. Blood flow distribution in cerebral arteries. J Cereb Blood Flow Metab 2015; 35: 648–654. [DOI] [PMC free article] [PubMed] [Google Scholar]
- 19.Amin-Hanjani S, Du X, Pandey DK, et al. Effect of age and vascular anatomy on blood flow in major cerebral vessels. J Cereb Blood Flow Metab 2015; 35: 312–318. [DOI] [PMC free article] [PubMed] [Google Scholar]
- 20.Jenkinson M, Beckmann CF, Behrens TE, et al. FSL. Neuroimage 2012; 62: 782–790. [DOI] [PubMed] [Google Scholar]
- 21.Smith SM. Fast robust automated brain extraction. Hum Brain Mapp 2002; 17: 143–155. [DOI] [PMC free article] [PubMed] [Google Scholar]
- 22.Jenkinson M, Smith S. A global optimisation method for robust affine registration of brain images. Med Image Anal 2001; 5: 143–156. [DOI] [PubMed] [Google Scholar]
- 23.Jenkinson M, Bannister P, Brady M, et al. Improved optimization for the robust and accurate linear registration and motion correction of brain images. Neuroimage 2002; 17: 825–841. [DOI] [PubMed] [Google Scholar]
- 24.Zhang Y, Brady M, Smith S. Segmentation of brain MR images through a hidden Markov random field model and the expectation-maximization algorithm. IEEE Trans Med Imaging 2001; 20: 45–57. [DOI] [PubMed] [Google Scholar]
- 25.Van Laar PJ, Hendrikse J, Golay X, et al. In vivo flow territory mapping of major brain feeding arteries. Neuroimage 2006; 29: 136–144. [DOI] [PubMed] [Google Scholar]
- 26.Borogovac A, Asllani I. Arterial spin labeling (ASL) fMRI: advantages, theoretical constrains, and experimental challenges in neurosciences. Int J Biomed Imaging 2012; 2012: 818456. [DOI] [PMC free article] [PubMed] [Google Scholar]
- 27.Alsop DC, Detre JA. Reduced transit-time sensitivity in noninvasive magnetic resonance imaging of human cerebral blood flow. J Cereb Blood Flow Metab 1996; 16: 1236–1249. [DOI] [PubMed] [Google Scholar]
- 28.Petersen ET, Mouridsen K, Golay X. The QUASAR reproducibility study, Part II: results from a multi-center arterial spin labeling test-retest study. Neuroimage 2010; 49: 104–113. [DOI] [PMC free article] [PubMed] [Google Scholar]
- 29.Bokkers RP, van der Worp HB, Mali WP, et al. Noninvasive MR imaging of cerebral perfusion in patients with a carotid artery stenosis. Neurology 2009; 73: 869–875. [DOI] [PubMed] [Google Scholar]
- 30.Hendrikse J, van Raamt AF, van der Graaf Y, et al. Distribution of cerebral blood flow in the circle of Willis. Radiology 2005; 235: 184–189. [DOI] [PubMed] [Google Scholar]
- 31.Gevers S, Nederveen AJ, Fijnvandraat K, et al. Arterial spin labeling measurement of cerebral perfusion in children with sickle cell disease. J Magn Reson Imaging 2012; 35: 779–787. [DOI] [PubMed] [Google Scholar]
- 32.Zbornikova V, Lassvik C. Duplex scanning in presumably normal persons of different ages. Ultrasound Med Biol 1986; 12: 371–378. [DOI] [PubMed] [Google Scholar]
- 33.Donis J, Graf M, Sluga E. Flow measurements in extracranial carotid arteries by means of duplex sonography. Results in normal subjects. Ultraschall Med 1988; 9: 216–222. [DOI] [PubMed] [Google Scholar]
- 34.Scheel P, Ruge C, Schoning M. Flow velocity and flow volume measurements in the extracranial carotid and vertebral arteries in healthy adults: reference data and the effects of age. Ultrasound Med Biol 2000; 26: 1261–1266. [DOI] [PubMed] [Google Scholar]