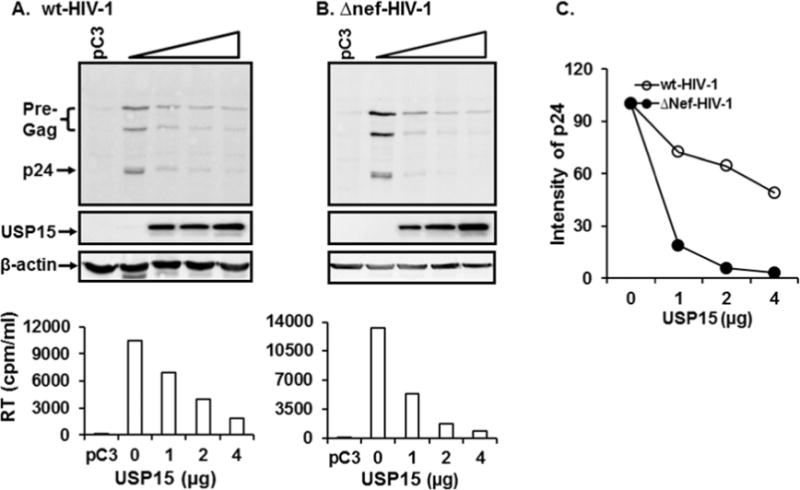
Figure 7.

Effect of USP15 on degradation of Gag and HIV-1 replication. (A) and (B) Western blot analysis from cells transfected with wt- and Δnef-HIV-1. Lane 1 indicates 293T cells transfected with isotype plasmids, while lanes 2 to 5 in (A) and (B) represent 293T cells transfected with 4 μg of wt- (A) or Δnef-HIV-proviral DNA together with 0, 1, 2, and 4 μg of USP15-expressing plasmid, respectively. Bar graphs below (A) and (B) represent replication activity of wt- and Δnef-HIV-1 in 293T cells measured by RT activity in the presence of different doses of USP15. (C) depicts relative amount of p24 in panel (A) and (B) normalized based on β-actin. The data were representative of three independent experiments.
