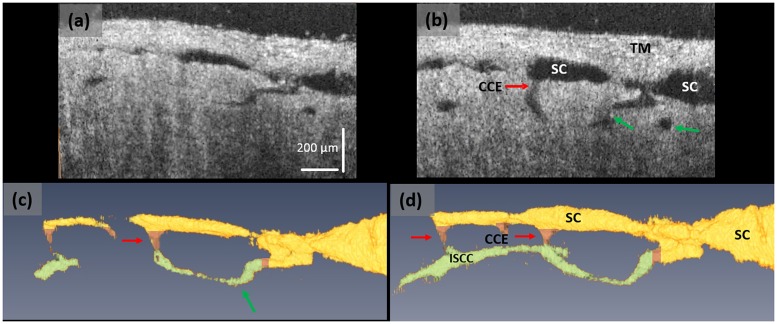
Fig 3. The SD-OCT system provides detailed images of microstructures within the AOS system.
(a) A representative OCT cross-sectional image cut longitudinally through SC at a pressure of 10 mmHg, and (b) the corresponding cross-section at 50 mm Hg. Images (c) and (d) are the 3D reconstructions of SC, CCE and ISCC within the same specimen under the pressures of (a) 10 and (b) 50 mm Hg, respectively. With the increase of pressure, the ISCCs move out of the 2D plane and are oriented closer to the observer in the 3D sections. Yellow color identifies the region of SC, pink the CCE, and green the ISCC. In image (c) at 10 mm Hg pressure, SC and the ISCC are smaller and in some areas absent in comparison with image (d) at 10 mm Hg.

