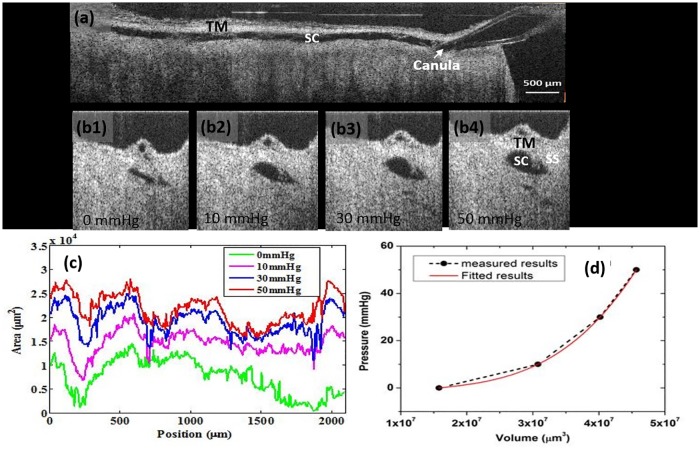
Fig 5. 3D OCT imaging provides the ability to quantify the response of Schlemm’s canal to controlled perfusion pressures ranging from 0 of 50 mm Hg.
(a) A composite cross-sectional image permits visualization of the entire length of ~8 mm of a limbal segment while maintaining a perfusion pressure of 50 mm Hg; SC is dilated along its entire length. A cannula is visible in SC at the right edge of the image of the segment and the trabecular meshwork (TM) is visible superior to the canal. OCT images (b1-b4) representing radial cross-sections through SC demonstrate progressive dilation of the canal as pressure increases from 0 to 50 mm Hg. (c) The curves represent the measured SC area at 10um intervals along the 2 mm limbal segment under pressures as indicated in the legend. (d) Elastance curve generated from measured SC volume increases resulting from changes in applied pressure.

