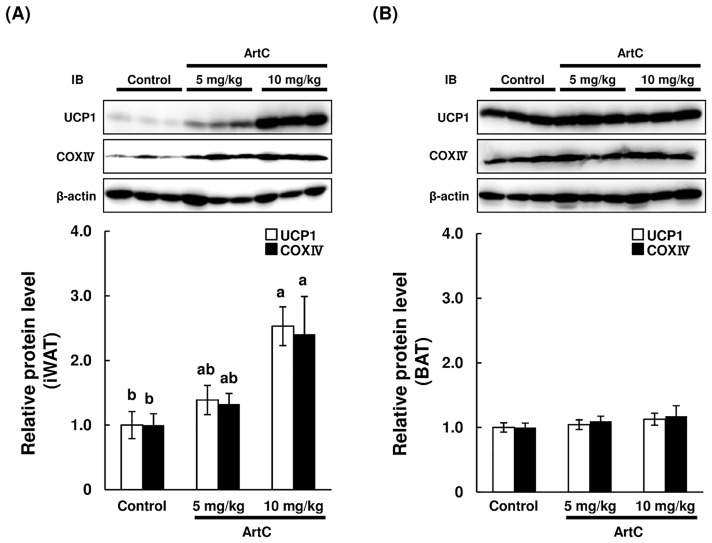
Fig 6. Immunoblot analysis of UCP1, CoxIV, and β-actin in the iWAT and BAT of mice treated with vehicle (control) or ArtC (5 mg/kg or 10 mg/kg) for 4 weeks.
(A) iWAT, (B) BAT. Relative protein levels are expressed as fold-change relative to control (= 1) after normalization using the β-actin protein level. Data are presented as means ± SEM (n = 9–10). Mean values without a common letter are significantly different at P < 0.05(Tukey-Kramer test).

