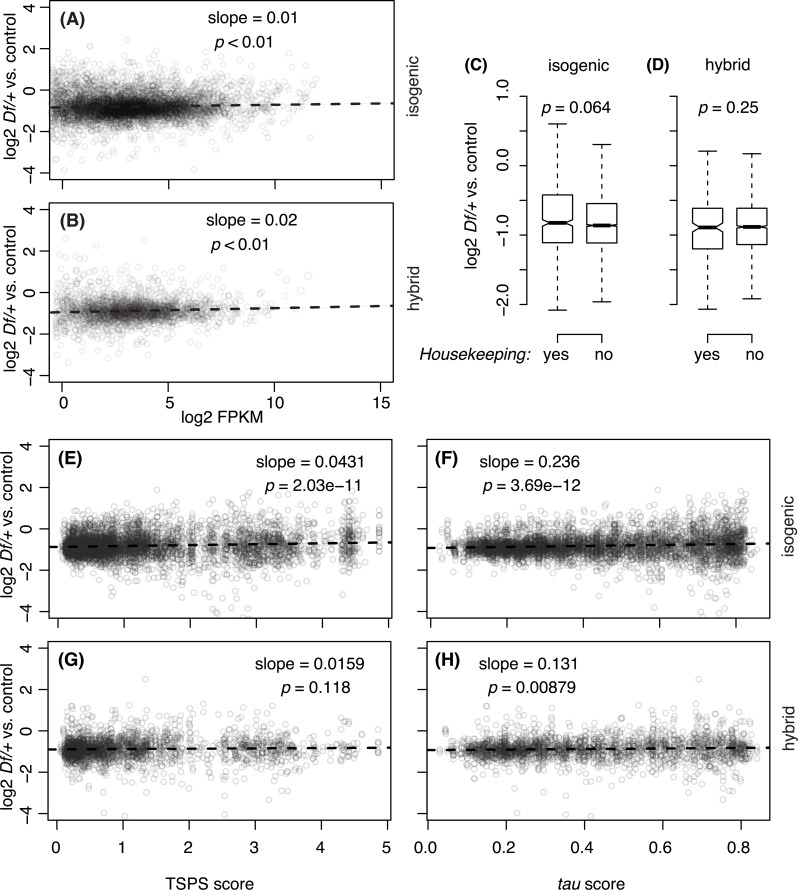
Fig 2. Autosomal dosage compensation of Df/+ genes with different expression levels or tissue specificities.
A, B) One copy versus two copy gene expression levels plotted against the median expression levels of replicates in Fragments Per Kilobase of transcript per Million mapped reads (FPKM). C, D) Boxplots that display different degree of autosomal dosage compensation of the genes that are classified as housekeeping, or non-housekeeping based on the Naïve Bayes Classifier [40]. p values are from Mann-Whitney U tests. E-H) Gene expression levels of Df/+ genes were plotted based on Tissue Specificity Score (TSPS, E,G) and tau score (F,H). For both scores, larger values indicate more tissue specific. Dashed lines in scatter plots, their slopes and p values are from linear modeling and the F-test. A, C, E, F) Results from the isogenic genetic background. B, D, G, H) from hybrid genetic background.

