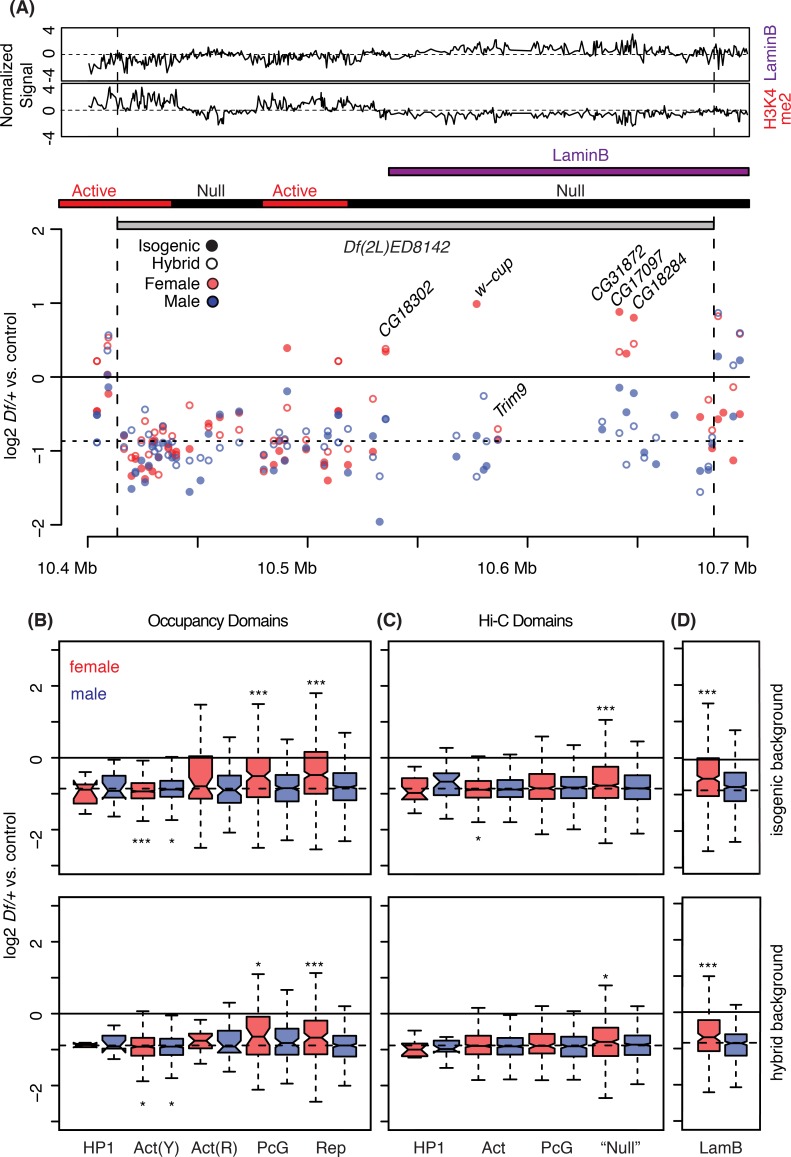
Fig 4. Disruption of chromatin and/or 3D nuclear domains by Df breaks.
A) One copy gene expression in Df(2L)ED8142/+ plotted across the deletion position in log2 scale. On the top, DamID (LaminB) or Chromatin immunoprecipitation (Histone H3K4me2) signals (Z-transformed, [42]) across the deletion region are displayed to represent “Active”, or “Null/Repressive” regions, respectively. Chromatin states defined in the Hi-C study [43] and position of LADs from the DamID analysis [44] are presented below the tracks (bars). See Fig 2 for additional labeling information. B-D) Autosomal dosage compensation levels were measured from one copy genes that mapped to different chromatin state domains (B), topologically associated domains (C), and Lamin associated domains (D) from DamID-chip and Hi-C studies. Top panels. Data from the isogenic genetic background (top) and hybrid genetic background (bottom) are shown. Domains are labeled according to diagnostic enrichments/functions from the original studies: Heterochromatin Protein 1 domain (HP1), "yellow" [Act(Y)] and "red" [Act(R)] active domains, Polycomb Group domain (PcG), repressive domain (Rep), undefined and other (Null), and Lamin B (or LAD) domain (LamB). * p < 0.05, ** p < 0.01, *** p < 0.001 (Mann-Whitney U test).

