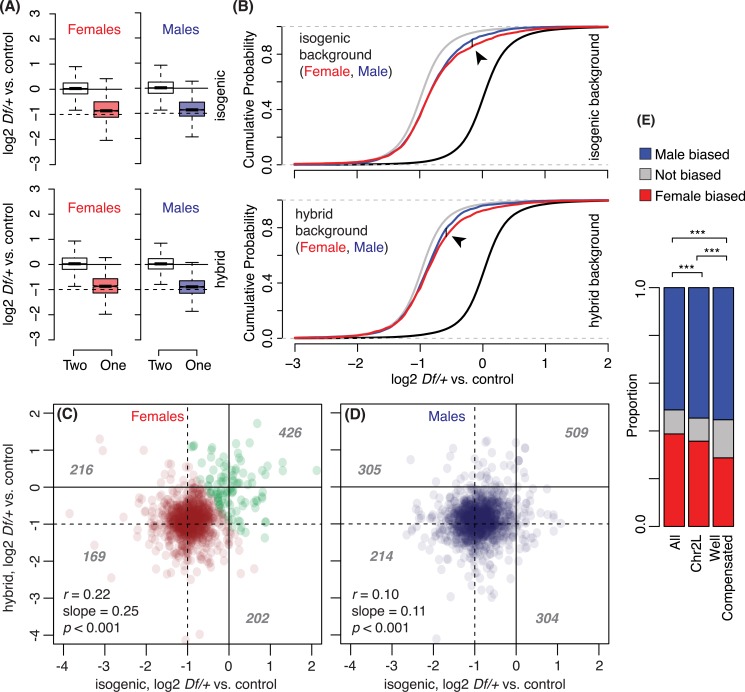
Fig 5. Sex-based difference in one copy gene expression.
A) Boxplots of gene expression in two copy genes (open) or one copy genes (red and blue for females and males, respectively) from all Df lines used (see Fig 1 for boxplot parameters). B) Cumulative distribution function plots for female Df/+ (red), male Df/+ (blue), and +/+ gene expression (black, for both sexes). The grey line displays +/+ gene expression level shifted by -1 (log2). Arrowhead indicates Kolmogorov-Smirnov statistic (D), the largest vertical differences between two cumulative distributions (0.045 for isogenic and 0.051 for hybrid). A, B) Data from isogenic (top) and hybrid (bottom) genetic backgrounds are shown. C, D) Scatter plots that compare one copy gene expression relative to two copy gene expression between the isogenic genetic background and hybrid genetic background. A subset of genes in (C) represents “better compensated” genes identified in clustering analysis (Green). The grey numbers on the plots indicate the number of Df/+ genes appeared in each quadrant, divided by (-1, -1). The same genes that are deficient in multiple Df/+ flies were counted multiple times. Pearson’s correlation coefficient (r), slopes from linear regression and p values (F-tests) are shown. E) Barplots that display the proportion of male-biased or female-biased genes from all Drosophila genes, chromosome 2L genes, and the better compensation in females (C, green). ***p < 0.001 (Hypergeometric test).

