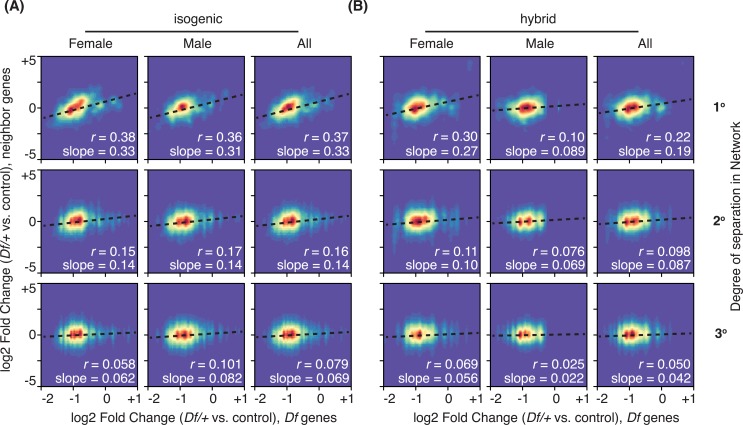
Fig 8. Propagation and dissipation of gene dose perturbation in positively correlating networks.
Density plots that display gene expression changes of two copy genes that are neighbors of Df genes in the integrative network by 1° (primary, top), 2° (secondary, middle) and 3° (tertiary, bottom) are collectively plotted from all used lines against the expression changes of Df genes (one copy, x-axis) in females (left), males (center) and combined (right). Results from both the A) isogenic and B) hybrid background are shown. Pearson’s correlation coefficient (r) and slopes from linear modeling are shown.

