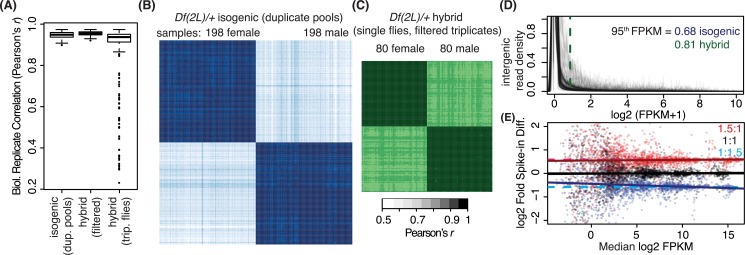
Fig 10. Replicate reproducibility in RNA-Seq results and determination of gene expression cutoff.
A) Box plots that display distribution of Pearson’s correlation coefficient (r) between experimental replicates. The second and third boxes demonstrate r values between replicates from the hybrid genetic background, where the second one is after filtering at r < 0.9. B, C) All sample-to-all sample pairwise comparisons. The opacity of color indicates Pearson’s r as illustrated in the key. D) RNA-Seq signals from intergenic regions are collectively overlaid as density plots across signal in FPKM. Median of the top 95 percentile in the distribution is indicated (dotted lines). E) Signals from ERCC spike-ins. A pair of spike-in sets is composed with known amount of RNA species that have either 1:1 or 1:1.5 ratios between libraries. In the plot, the black horizontal line indicates expected fold difference from the subpool of spike-in RNAs that have 1:1 ratio between the pair. Red and Blue horizontal line show the expected fold differences from subpools of external RNA that have 1:1.5 ratios. Red, Black, and Blue points indicate the actually measured ratio of each spike-in RNA species after normalization, at different abundances of gene expression (x-axis). Dot lines are trend lines from linear modeling.

