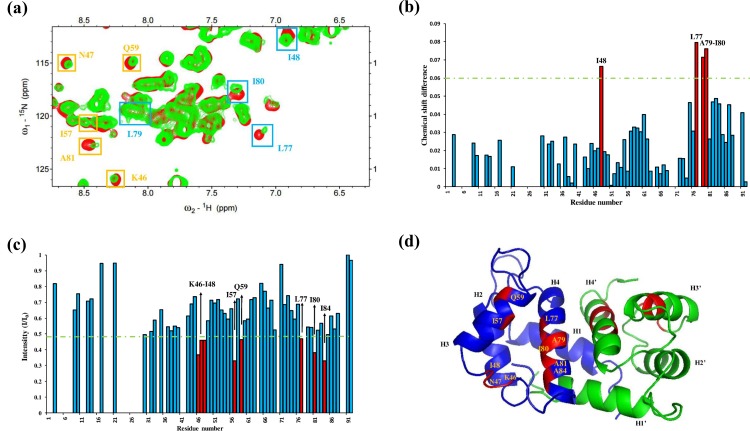
Fig 1. Analysis of the 1H–15N HSQC spectra of S100A12 in complex with the unlabeled RAGE V domain.
(a) Overlay of the 1H–15N HSQC spectra of 0.76 mM 15N-labeled S100A12 (red) and S100A12 in complex with 0.76 mM unlabeled RAGE V domain (green). The residues that changed are indicated by yellow (decreased intensity) and cyan (perturbation) boxes, and were identified using bar diagrams. (b) Bar graph of cross-peak chemical shift perturbation where the green line represents the threshold of selected residues exhibiting significant changes. (c) Bar graph of cross-peak intensity (I/I0), where I represents the cross-peak intensity of the spectra of the complex solution (S100A12–RAGE V domain) and I0 is the cross-peak intensity of the spectra of S100A12 alone. (d) Ribbon representation of S100A12, the residues exhibiting significant changes are marked in red. H1 to H4 indicate helix 1 to helix 4 in the S100A12 monomer.

