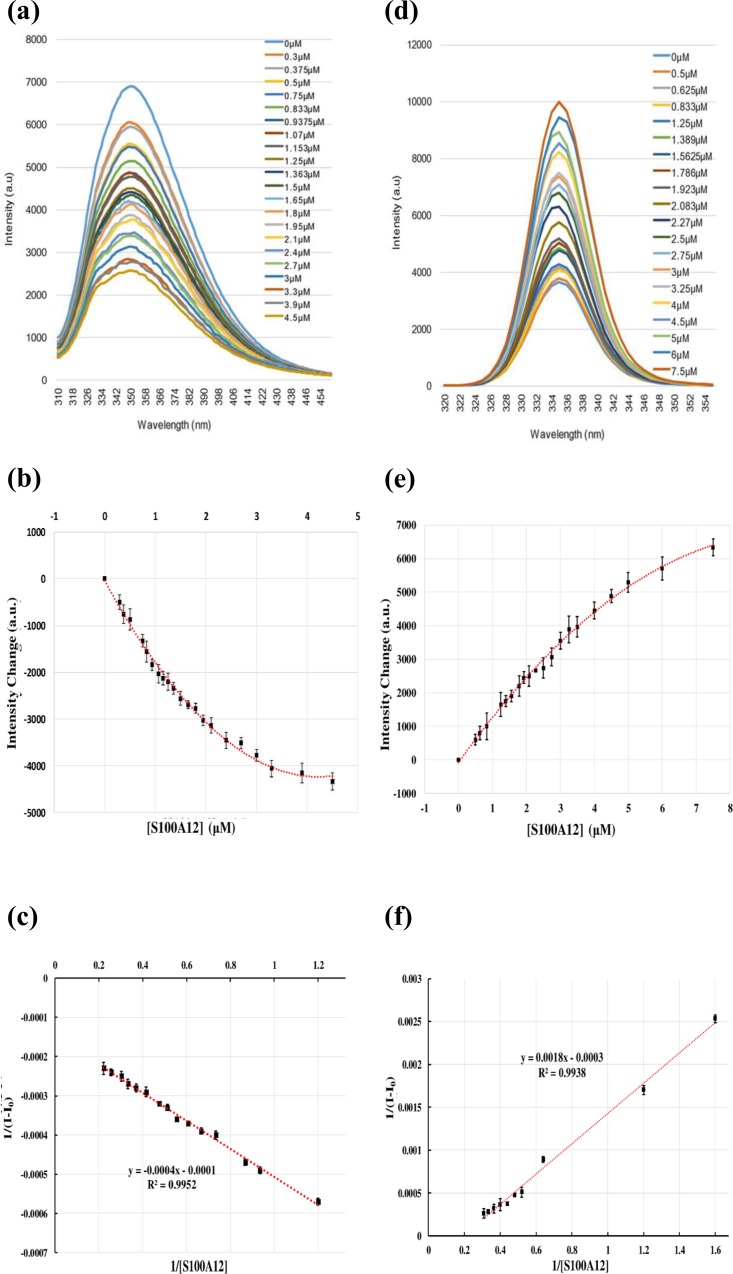
Fig 5. Fluorescence measurements of S100A12 with the RAGE V domain and tranilast.
(a) Fluorescence curve of the titration between S100A12 and the RAGE V domain. The initial concentration of the RAGE V domain was 1.5 μM; this was titrated with S100A12 at a concentration of 0–4.5 μM. (b) Curve showing the titration of the RAGE V domain with S100A12 with changes in fluorescence intensity. (c) Linear curve showing the dissociation constant to be 3.1 ± 1.4 μM. The original curve was further processed and calculated using Eq (1). To fit to a linear curve, some outlying points were removed. (d) Fluorescence curve of the titration between S100A12 and tranilast. The initial concentration of tranilast was 2.5 μM; S100A12 was added at a concentration of 0–7.5 μM to measure the emission changes. (e) Curve showing the titration of tranilast with S100A12. (f) Linear curve showing the dissociation constant to be approximately 6.1 ± 1.4 μM. Some points were removed to fit to a linear curve. For all fluorescence experiments, each titration was replicated three times and the error bars are shown on the curves.

