Figure 5.
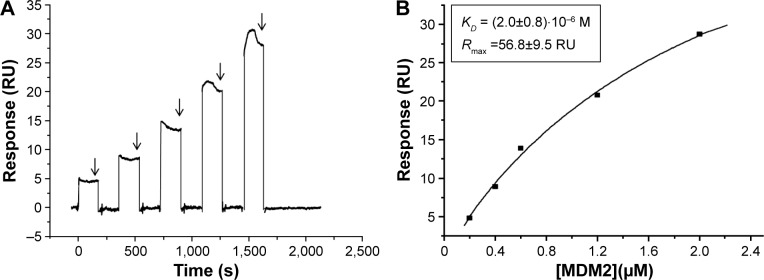
SPR single-cycle kinetic of MDM2–MDM4 interaction.
Notes: (A) Sensorgram of the response (RU) versus time of the single-cycle kinetics assay performed by injecting five increasing concentrations (0.2, 0.4, 0.6, 1.2, 2.0 µM) of MDM2 on the MDM4 substrate, without any regeneration. Arrows indicate the steady state for each sample injection. (B) Plot of SPR response (RU) at the steady state versus the MDM2 concentration used for the binding assay. By fitting data with the steady state affinity model (Biacore X100 Evaluation software) (black curve), the equilibrium dissociation constant (KD) and the analyte binding capacity (Rmax) values reported in the insert were obtained.
Abbreviations: MDM2, murine double minute 2; MDM4, murine double minute 4; RU, resonance units; SPR, surface plasmon resonance.

