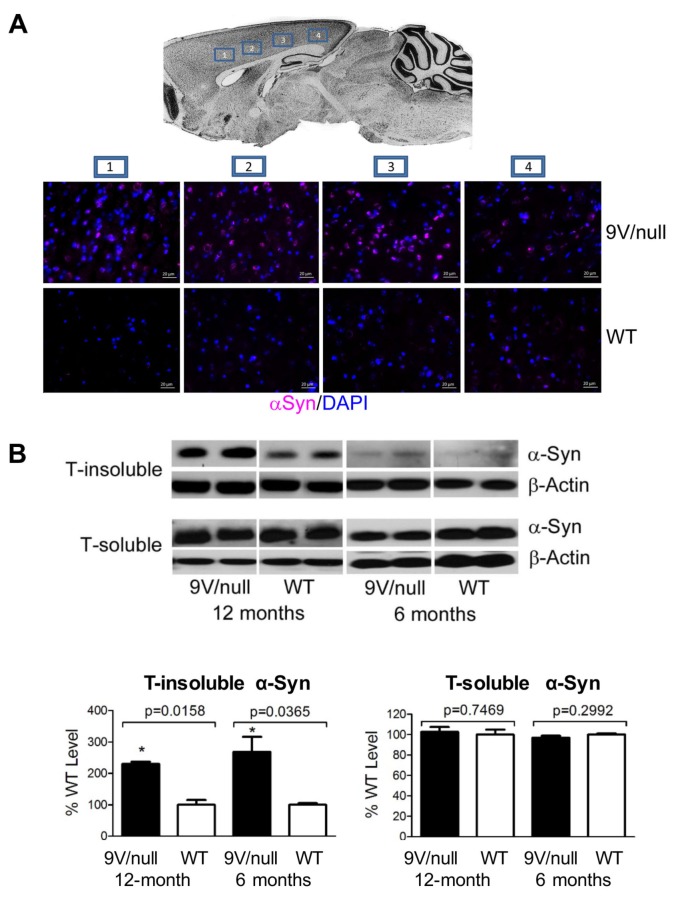
Fig 6. α-Synuclein (αSyn) pathology.
A: αSyn aggregates in cortex. Brain map shows four images taken from areas within cortex region including 1) motor, 2) somatosensory, 3) auditory, and 4) visual (upper panel). Representative images are shown with αSyn (violet) signals detected in all 4 brain regions of 9V/null and WT mice at 12 months of age. DAPI (blue) stained nuclei. Scale bars represent 20 μm. B: Immunoblot of αSyn. Upper panel, Triton X-100 insoluble (T-insoluble) αSyn and Triton X-100 soluble (T-soluble) αSyn in the cortex of 9V/null and WT mice at 6 months and 12 months of age, respectively. Lower panel, semi-quantitation of T-insoluble and T-soluble αSyn levels. 9V/null cortex had significantly increased T-insoluble αSyn at 6 and 12 months of age compared to age-matched WT cortex. The levels of T-insoluble αSyn in 6 month-cortex were lower than that in 12 month-cortex. No difference in T-soluble αSyn were found between 9V/null and WT at 6 and 12 months of age. The blots were derived from 3–4 experimental repeats, n = 2–3 mice/group. Intensity of protein bands on the blot were quantified by NIH Image J. The intensity of αSyn was normalized by intensity of β-actin for each sample. The αSyn level in 9V/null was presented as percentage of WT level at each age. P-values are from Student’s t-test.

