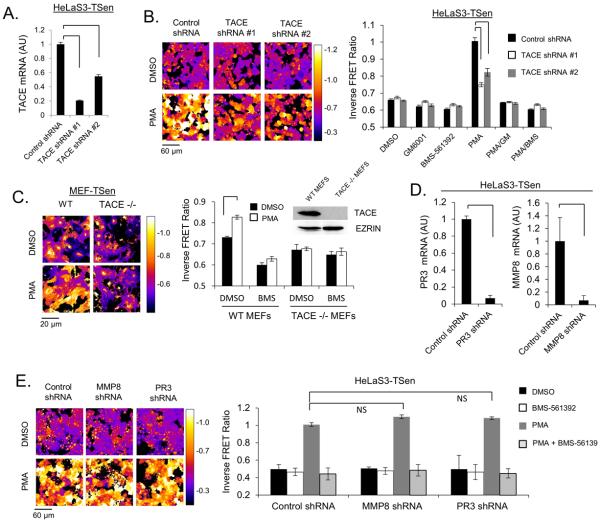
Fig. 2. TSen Reports TACE activity with High Specificity.
(a) mRNA levels of TACE in HeLaS3-TSen upon depletion of TACE by RNAi. (b) Activation of TACE in TACE knockdown HelaS3-TSen cells after 1 hour PMA treatment. (c) Activation of TACE in WT and TACE −/− MEF-TSen cells after 1 hour PMA treatment. Inset displays a western blot analysis of TACE protein levels in TACE −/− cells. (d) mRNA levels of PR3 or MMP8 in HeLaS3-TSen upon depletion of PR3 or MMP8 by RNAi. (e) Activation of TACE in PR3 or MMP8 knockdown HelaS3-TSen cells after 1 hour PMA treatment. Note that y-axes minimums are not always set to a value of 0. For microscopy experiments, N=3 trials, where each trial represents>500 cells. Brackets indicate relevant comparisons where p<0.01, t-test, if not labeled with NS (p>0.01). All experiments are representative of at least 2 independent experiments.

