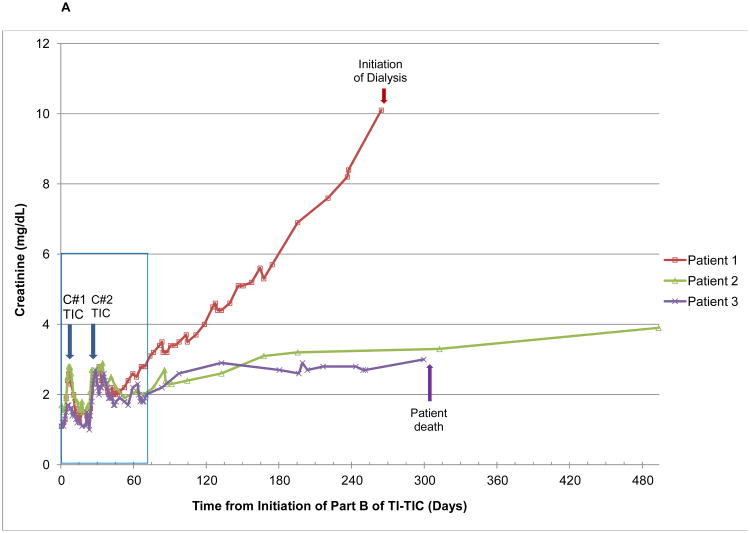
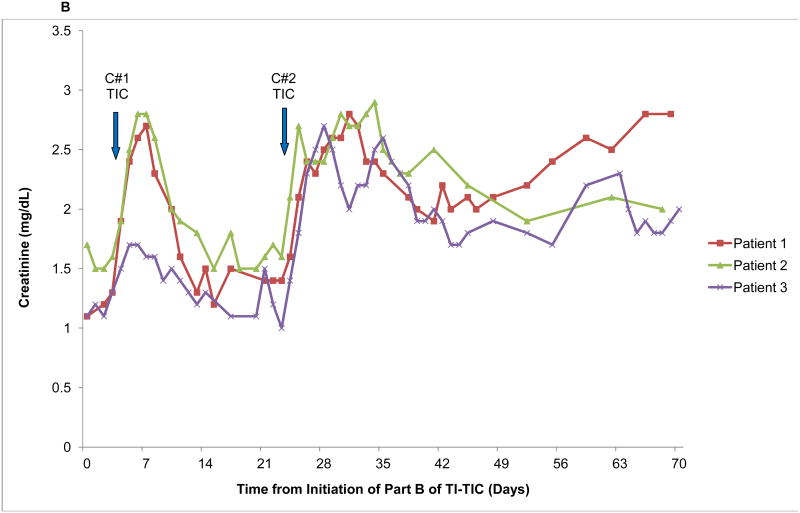
Figure 2.
Graphical illustration of creatinine Levels in the Three Patients who Developed Chronic Renal Insufficiency with High-Dose Paclitaxel, Ifosfamide, and Carboplatin A) From the start of treatment and including long-term followup and B) During treatment only. The insert in Figure 2A is the short-term creatinine changes depicted on a larger scale in Figure 2B. Blue arrows denote the timing of initiation of the two cycles of chemotherapy (C#1, cycle number 1 and C#2, cycle number 2).


