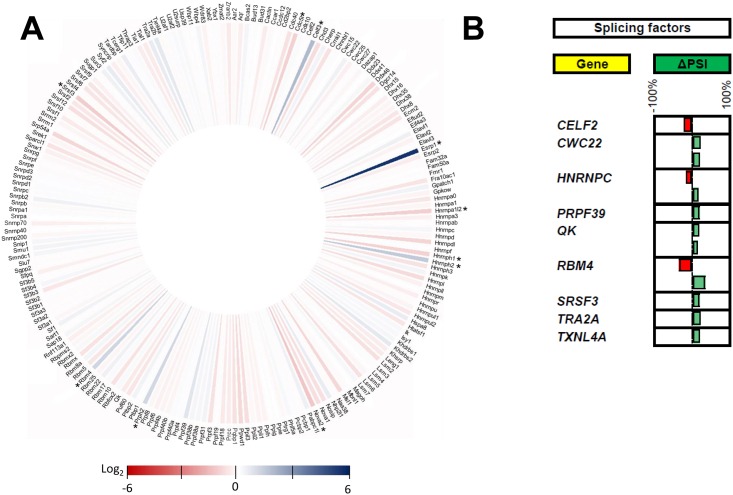
Fig 6. Proteins involved in RNA splicing.
(A) Iris graph displaying the expression profile of proteins involved in RNA splicing. Differences in gene expression levels are shown on a logarithmic color scale (Log2). The expression of only 10 proteins involved in splicing was modulated by more than 2-fold upon infection (indicated by an asterisk). (B) Modifications to the splicing profiles of proteins involved in RNA splicing upon viral infection. Nine splicing factors were differentially spliced following viral infection. The changes in PSI values are indicated in red (negative delta PSI) or green (positive delta PSI).

