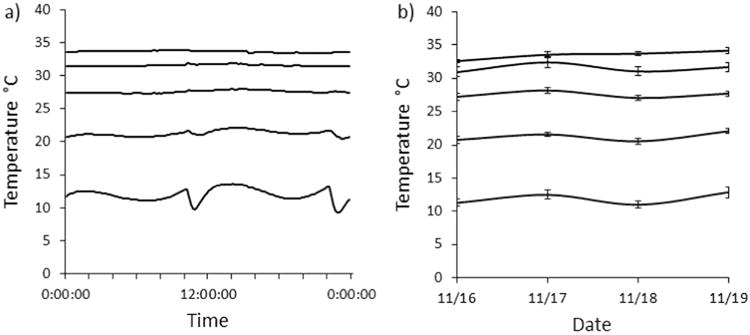
Fig. 3.

Variation in substrate surface temperature within and across gutters and within and across days. (a) Mean substrate surface temperature for five equally spaced positions in the apparatuses (n=7) over 24 h. The variation in the curves in the coldest section of the apparatuses is a product of the ice packs melting and being replaced every 12 h, which shifted temperature 4.12 °C (±0.31 °C SE) twice daily. (b) Mean (±SE) temperature for five equally spaced positions in the apparatuses (n = 7) over 4 days, showing the consistency in measurements at each location. There was no significant effect of date on temperature across the gradient (F = 0.03, df = 3, p = 0.88).
