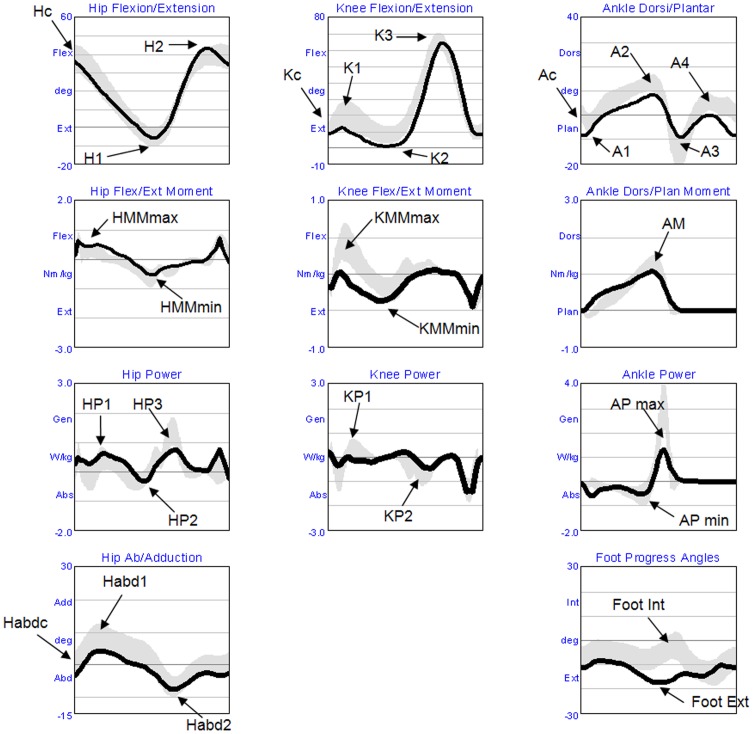
Fig 1. Kinetic/Kinematics parameters.
The figure shows the time series of the variables examined in the paper. In the horizontal axis is represented the time normalized respect to the duration of the gait cycle (from the hell contact to the floor to the ipsilateral succeeding hell contact). The arrows indicate the peak values here studied. The black line represents the mean values of the baseline of the patient with FRDA, while the gray band represents the standard deviation of the control group. In the first row are represented in degree the flexion and extension rotation of the hip, the knee and the ankle, from left to right respectively. In the second and third rows are represented joints moment and power, respectively, normalized respect to body wheight. In the four row is represented the hip ab-adduction and the angle of the internal end external rotation of the foot.

