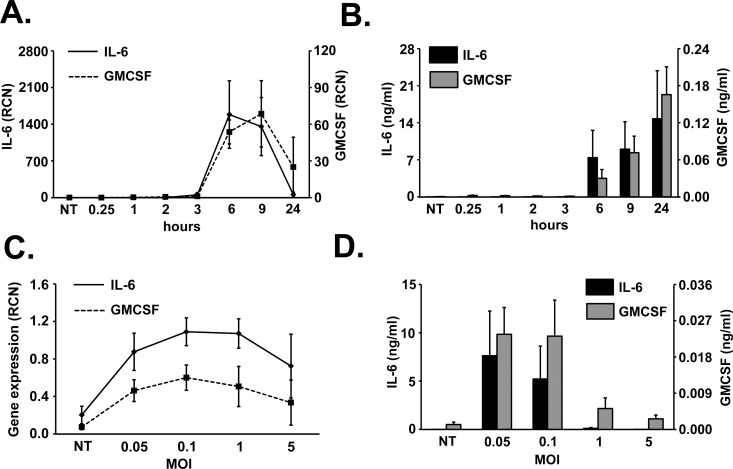
Fig 3. Cytokine kinetics in monocytes in response to D39.
Human monocytes (106 cells/ml) (A, B) were infected with D39 at an MOI of 0.1 for different time periods through 24 h or were infected with different MOIs of D39 for (C) 3 h or (D) 6 h. Cell extracts were analyzed for (A, C) mRNA expression using qPCR or (B, D) cytokine release using ELISA. The graphs represent the mean ± SEM of 3 independent experiments. NT stands for not treated.

