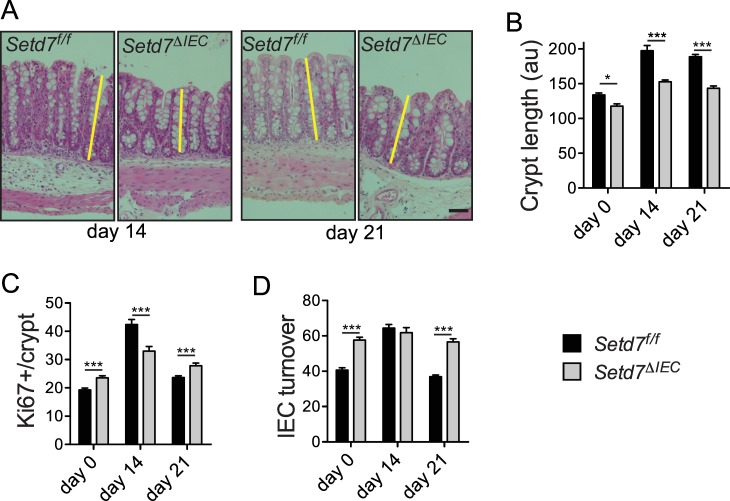
Fig 3. Setd7 regulates IEC turnover responses after T. muris infection.
(A) H&E stained caecal sections of Setd7 f/f and Setd7 ΔIEC mice at day 14 and day 21 post infection with T. muris. Yellow lines indicate crypt length. Original magnification is 100X. Bar = 50 μm (B) Crypt length (au = arbitrary units) of caecums of naïve (day 0) and T. muris infected mice (day 14 and day 21 post infection). (n≥30 of at least 4 mice, * P<0.05, *** P<0.001). (C) Proliferation as measured by counting Ki67+ cells per crypt from images such as in S4A. (n≥20 of at least 4 mice, *** P<0.001). (D) IEC turnover was determined by dividing Ki67+ cells by total DAPI+ cells from images such as shown in S4A. Of note, crypt length correlated with total DAPI+ cells per crypt at all time points (see S4C). (n≥20 of at least 4 mice, *** P<0.001).

