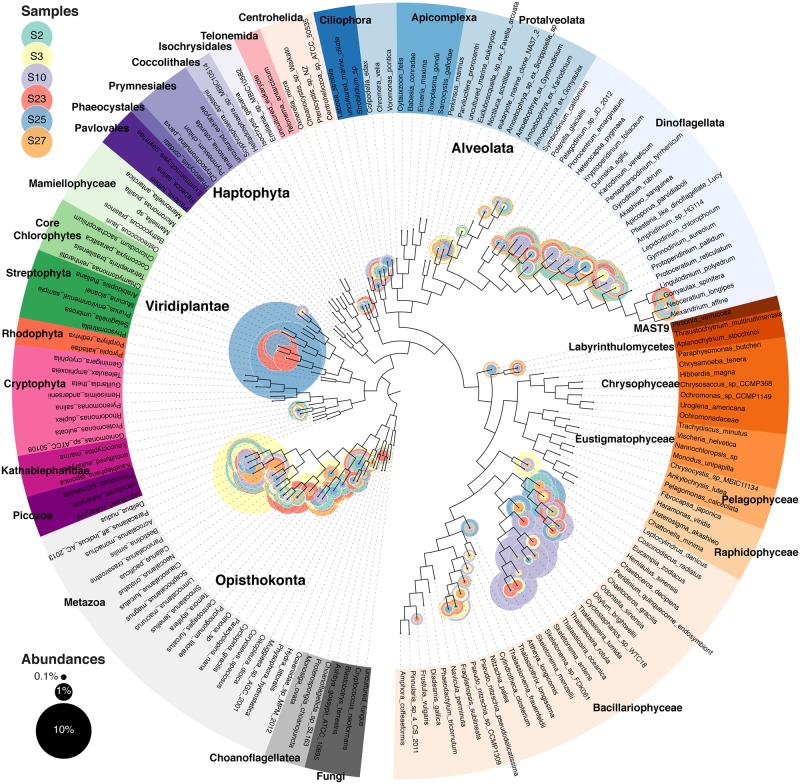
Fig 2. Metagenomic profiling of 18S rDNA for all six stations.
Nuclear small subunit 18S rDNA maximum likelihood tree with the placement of environmental sequences. Each circle represents one branch, and sizes are proportional to the normalized taxonomic abundances. Individual trees for each station can be found in Supplemental Materials (S2, S3, S4, S5, S6 and S7 Figs).

