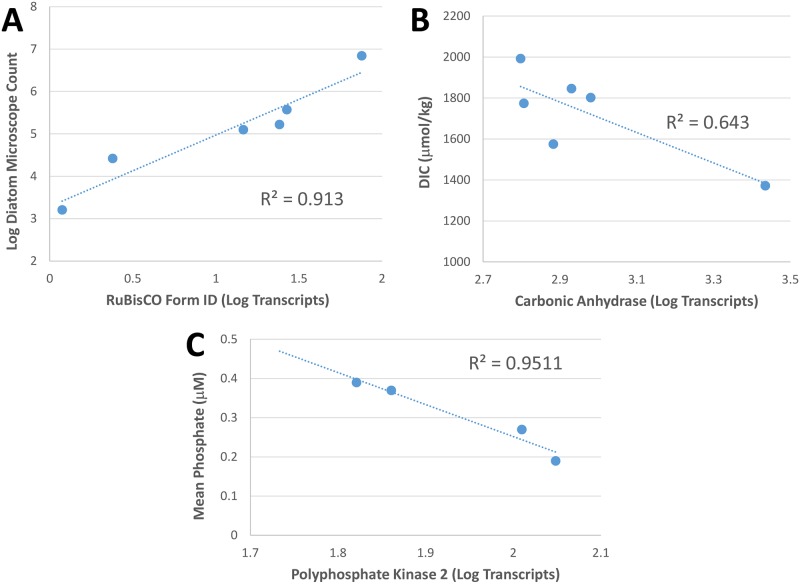
Fig 3. Transcriptomic versus biogeochemical data.
Panel A: The correlation between diatom microscope counts and log RuBisCO Form ID transcripts counts. Panel B: The inverse relationship of carbonic anhydrase transcript abundance to DIC concentration. Panel C: The inverse relationship between polyphosphate kinase transcript abundance and phosphate concentration. Station 2 and 25 had little or no phosphate, due to the diatom bloom, however ppk was not upregulated.

