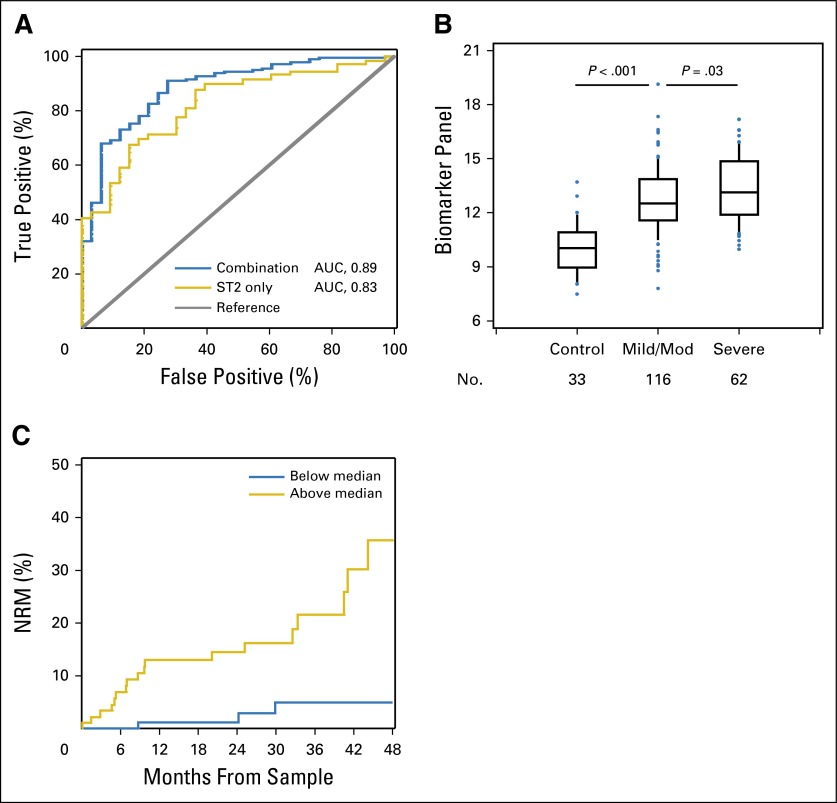
Fig 1.
(A) Receiver operating characteristic (ROC) curves for the best single biomarker and the combination model in verification cohort 1. ROC curves for the best single biomarker (ST2; area under the curve [AUC], 0.83) and the combination model (AUC, 0.89) comparing patients with chronic graft-versus-host disease (cGVHD; n = 178) and time-matched controls without cGVHD (n = 33). AUC values are reported from multivariable models. (B) Increased biomarker panel levels are associated with increased cGVHD severity in verification cohort 1. Median value of the four-biomarker panel from controls (n = 33), patients with mild to moderate (Mod) cGVHD (n = 116), and patients with severe cGVHD (n = 62) in verification cohort 1. Data are illustrated as box and whisker plots, with the whiskers indicating the 90th and 10th percentiles. P values compare controls versus patients with mild to moderate cGVHD, and patients with mild to moderate cGVHD versus those with severe cGVHD, according to Wilcoxon two-sample tests. (C) Nonrelapse mortality (NRM) stratified by the biomarker panel in verification cohort 1. The cumulative incidence of NRM is plotted, divided according to the median value of the biomarker panel among patients with cGVHD. The NRM at 48 months was 5% (95% CI, 1% to 9%) for the group less than the median value and 36% (95% CI, 19% to 53%) for the group greater than the median value (P = .002; adjusted for age, sex, donor [matched sibling v others], stem-cell source [peripheral-blood stem cells v others], conditioning intensity [myeloablative v others], prior acute GVHD, and time from hematopoietic cell transplantation to sample collection).

