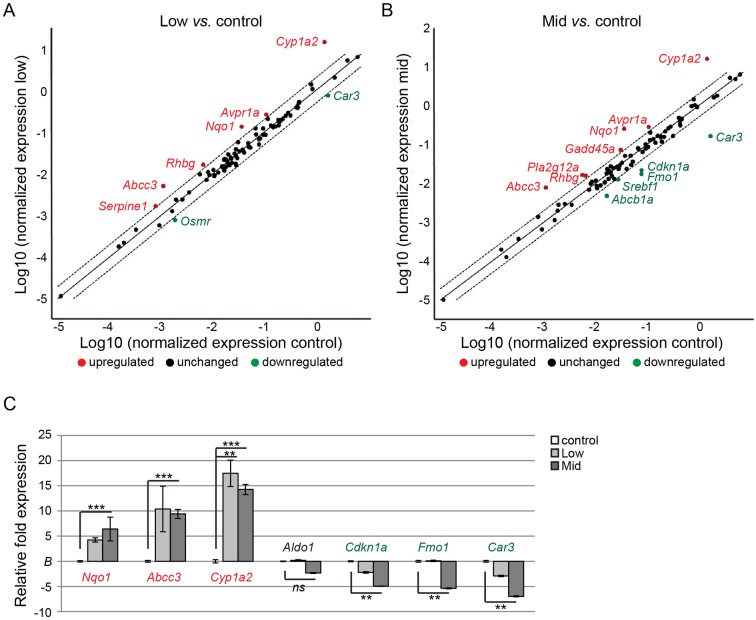
Fig 5. Relative mRNA levels of hepatotoxicity marker genes.
A,B) Scatter-plots of differentially expressed hepatotoxicity biomarker genes in livers of control animals and animals from Low- and Mid-dose mixture groups. Relative fold expression was determined from average transcript abundance across groups (n = 4 from each group). Genes up-regulated more than 2-fold are highlighted in red and genes down-regulated more than 2-fold highlighted in green. Dashed lines indicate two-fold change in expression relative to controls (whole line). C) The targeted gene array was verified by TaqMan RT-qPCR assays on 7 genes across the animal groups (n = 4 from each group). The identified up-regulated genes Nqo1, Abcc3 and Cyp1a2, unaltered gene Aldo1, and down-regulated genes Cdkn1a, Fmo1 and Car3 all showed similar expression profile as from the array. Statistical significance was determined by two-tailed, unpaired Student’s t-test (*p <0.05, **p<0.01 and ***p<0.001).

