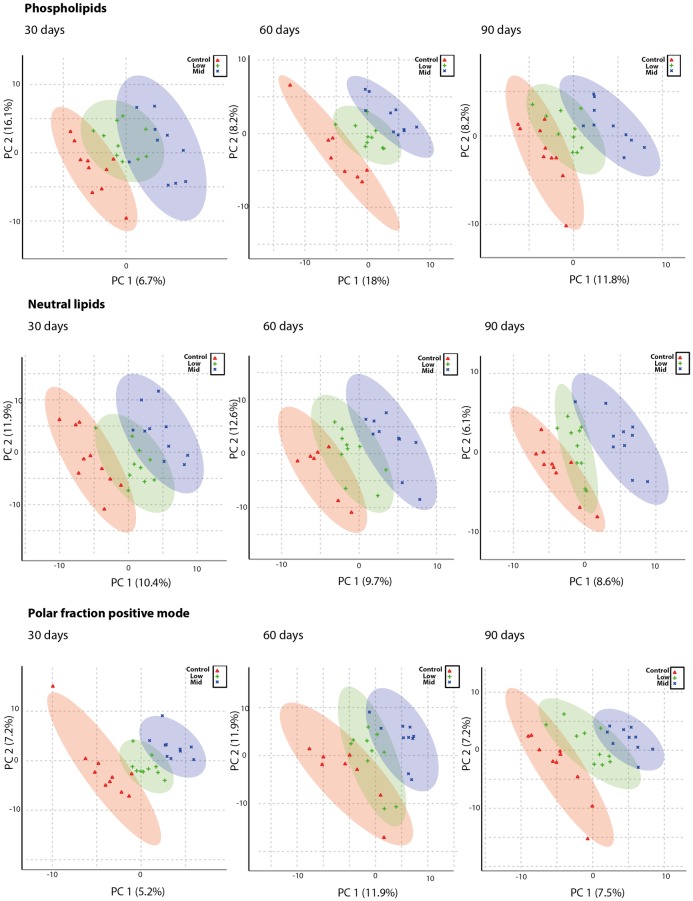
Fig 6. PLS DA plots of metabolomics data show that the Low-dose has an overall effect on the metabolome.
Plasma from rats administered Low- and Mid-dose for 30, 60 or 90 days was separated into a phospholipid, a neutral lipid and a polar fraction. These were separated by HPLC and analyzed by MS using the positive ionization mode (positive mode) and for the polar fraction also the negative mode. A clear separation of experimental groups is evident shown as a dose-dependent effect on the metabolome of the mixture and as well as a low dose effect on the metabolome. Red groups are control, green are Low-dose and blue are Mid-dose. Numbers given in brackets at the axes designate the percentages of variation accounted for by the specific principal components (PCs).

