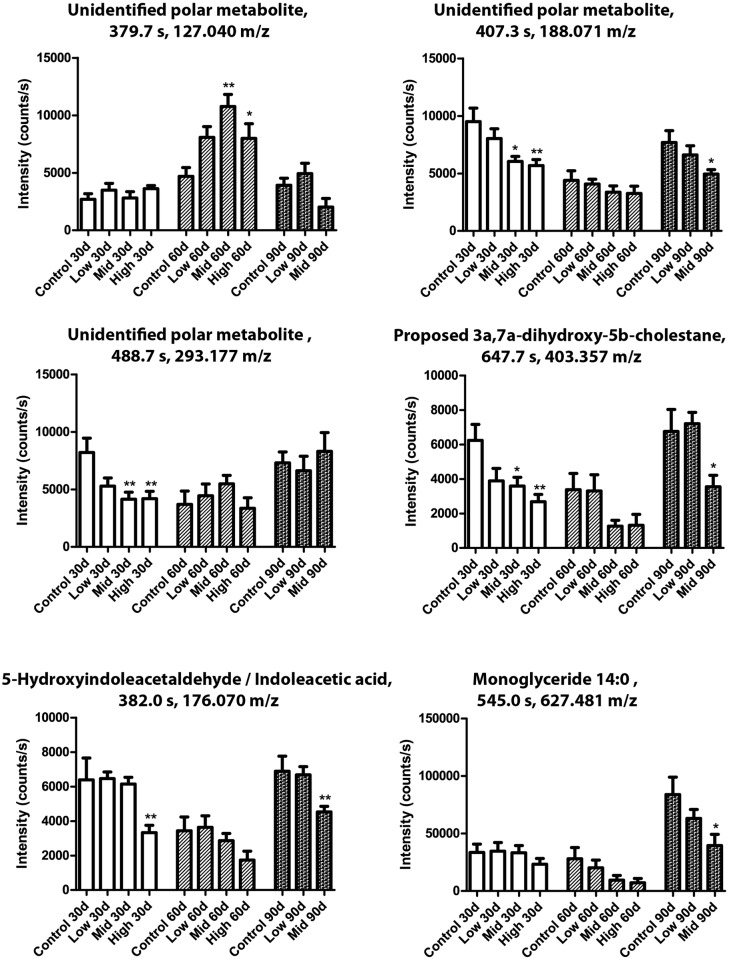
Fig 9. Polar metabolites were altered by the mixture.
Metabolome analysis of rat blood after 30, 60 or 90 days of exposure. N = 10 for each group, Data are presented as Mean ± SEM. The data were statistically tested as groups versus controls at each respective time point. The tests were one-way ANOVA with Dunnett’s post-test for normal distributed data or with Kruskal-Wallis with Dunn’s post-test for data that were not normal distributed (*p <0.05, **p<0.01 and ***p<0.001).

