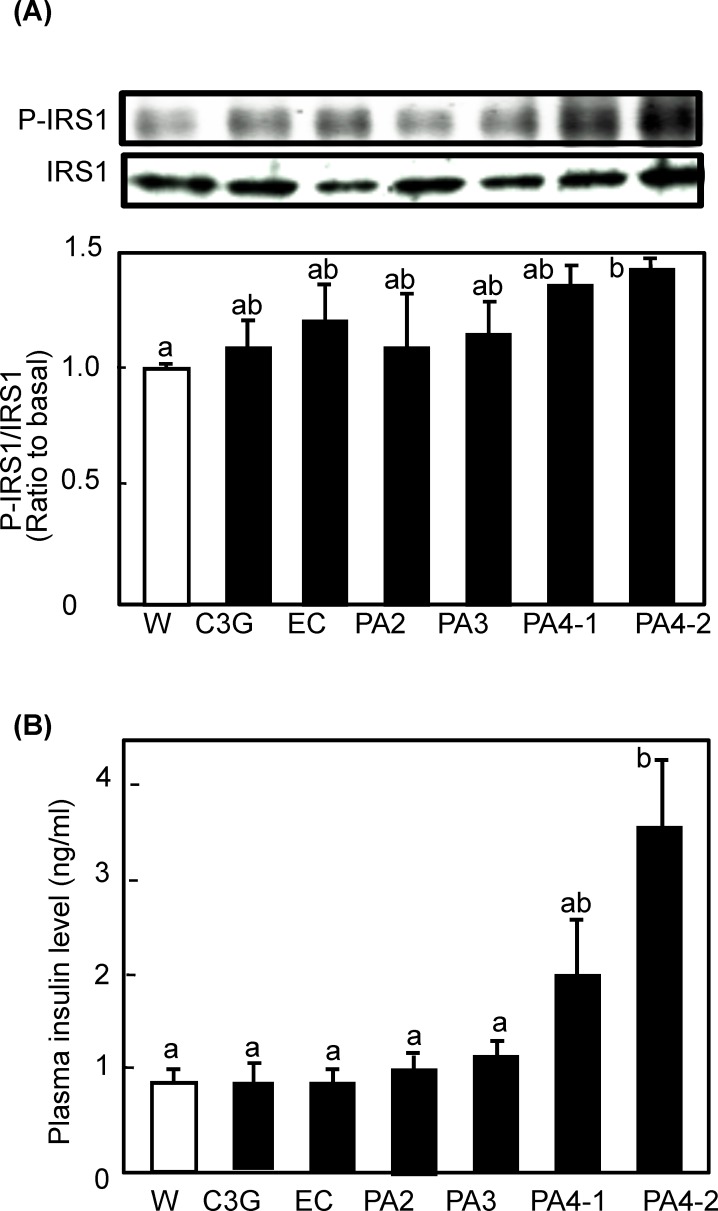
Fig 4. Effect of procyanidins, EC and C3G on phosphorylation of IRS-1 in skeletal muscle of mice.
ICR mice were treated as described in Fig 2. (A) Tissue lysate of skeletal muscle was prepared 60 min after the administration and subjected to immunoblotting analysis to determine p-IRS-1 and IRS-1. Each panel shows a typical result from six animals. The density of each band was analyzed and shown in the bottom panel. (B) Level of plasma insulin was determined by an ELISA kit. Values are means ± SE (n = 6). Different superscripted letters indicate significant differences between the groups (p <0.05; Tukey-Kramer multiple comparison test).

